Bermudan vs Guyanese Female Disability
COMPARE
Bermudan
Guyanese
Female Disability
Female Disability Comparison
Bermudans
Guyanese
12.7%
FEMALE DISABILITY
1.0/ 100
METRIC RATING
261st/ 347
METRIC RANK
12.1%
FEMALE DISABILITY
64.7/ 100
METRIC RATING
161st/ 347
METRIC RANK
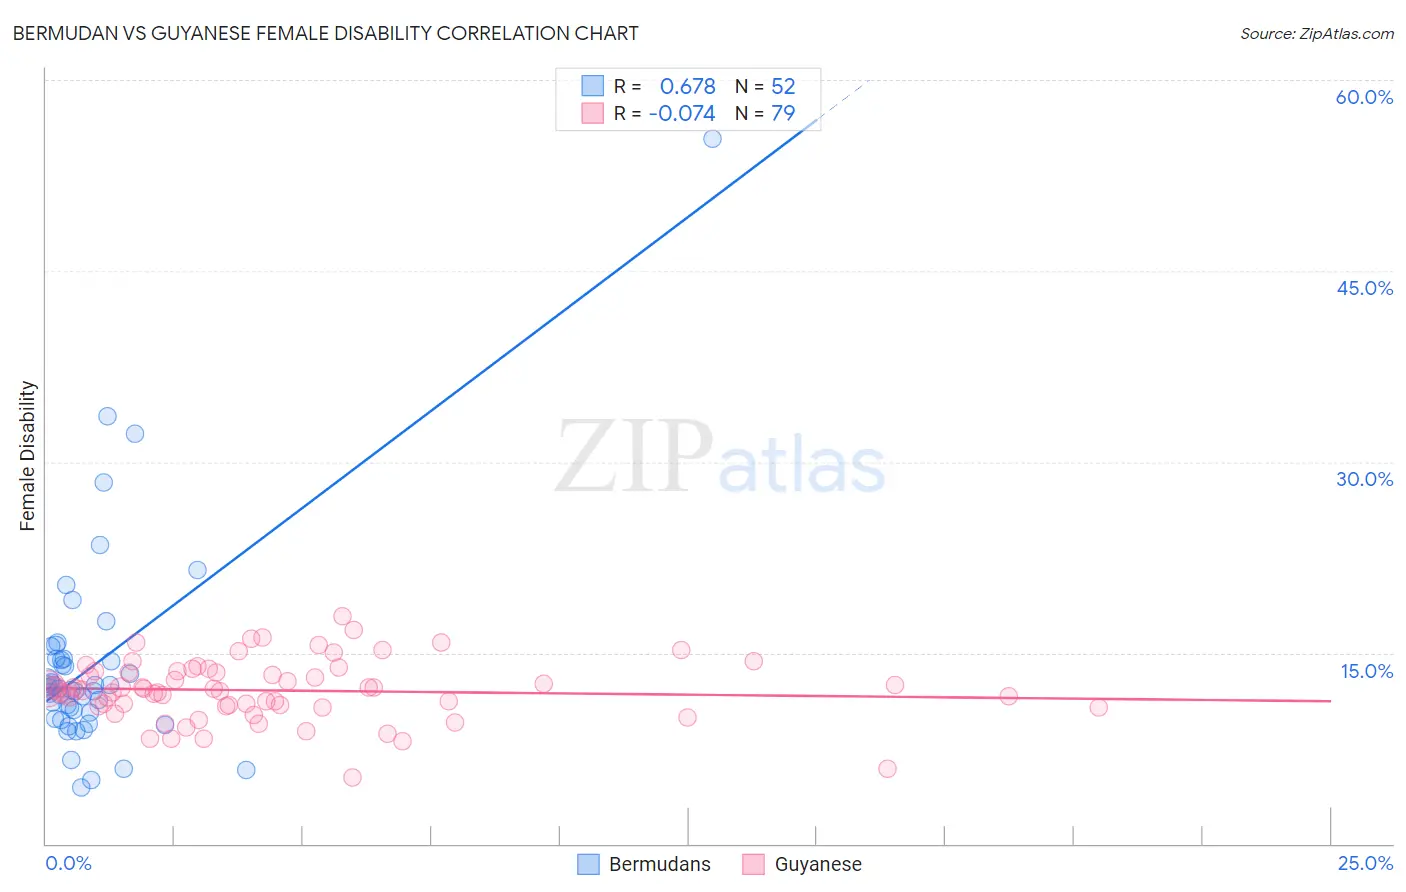
Bermudan vs Guyanese Female Disability Correlation Chart
The statistical analysis conducted on geographies consisting of 55,721,549 people shows a significant positive correlation between the proportion of Bermudans and percentage of females with a disability in the United States with a correlation coefficient (R) of 0.678 and weighted average of 12.7%. Similarly, the statistical analysis conducted on geographies consisting of 176,903,596 people shows a slight negative correlation between the proportion of Guyanese and percentage of females with a disability in the United States with a correlation coefficient (R) of -0.074 and weighted average of 12.1%, a difference of 5.0%.
Female Disability Correlation Summary
| Measurement | Bermudan | Guyanese |
| Minimum | 4.4% | 5.2% |
| Maximum | 55.4% | 17.8% |
| Range | 51.1% | 12.6% |
| Mean | 14.1% | 12.0% |
| Median | 12.2% | 12.2% |
| Interquartile 25% (IQ1) | 10.1% | 10.8% |
| Interquartile 75% (IQ3) | 14.5% | 13.5% |
| Interquartile Range (IQR) | 4.5% | 2.7% |
| Standard Deviation (Sample) | 8.3% | 2.4% |
| Standard Deviation (Population) | 8.2% | 2.4% |
Similar Demographics by Female Disability
Demographics Similar to Bermudans by Female Disability
In terms of female disability, the demographic groups most similar to Bermudans are Subsaharan African (12.7%, a difference of 0.040%), Immigrants from Armenia (12.7%, a difference of 0.050%), Czechoslovakian (12.7%, a difference of 0.070%), Liberian (12.7%, a difference of 0.14%), and Aleut (12.7%, a difference of 0.14%).
| Demographics | Rating | Rank | Female Disability |
| Hawaiians | 1.4 /100 | #254 | Tragic 12.7% |
| Immigrants | Germany | 1.3 /100 | #255 | Tragic 12.7% |
| British West Indians | 1.2 /100 | #256 | Tragic 12.7% |
| Liberians | 1.1 /100 | #257 | Tragic 12.7% |
| Aleuts | 1.1 /100 | #258 | Tragic 12.7% |
| Immigrants | Armenia | 1.0 /100 | #259 | Tragic 12.7% |
| Sub-Saharan Africans | 1.0 /100 | #260 | Tragic 12.7% |
| Bermudans | 1.0 /100 | #261 | Tragic 12.7% |
| Czechoslovakians | 0.9 /100 | #262 | Tragic 12.7% |
| Spaniards | 0.7 /100 | #263 | Tragic 12.8% |
| Alaska Natives | 0.6 /100 | #264 | Tragic 12.8% |
| West Indians | 0.5 /100 | #265 | Tragic 12.8% |
| Finns | 0.4 /100 | #266 | Tragic 12.8% |
| Senegalese | 0.4 /100 | #267 | Tragic 12.8% |
| Immigrants | Laos | 0.4 /100 | #268 | Tragic 12.8% |
Demographics Similar to Guyanese by Female Disability
In terms of female disability, the demographic groups most similar to Guyanese are Immigrants from Ukraine (12.1%, a difference of 0.010%), Guatemalan (12.1%, a difference of 0.030%), Czech (12.1%, a difference of 0.040%), Immigrants from Guatemala (12.1%, a difference of 0.060%), and Immigrants from Oceania (12.1%, a difference of 0.11%).
| Demographics | Rating | Rank | Female Disability |
| Syrians | 76.9 /100 | #154 | Good 12.1% |
| Ghanaians | 76.6 /100 | #155 | Good 12.1% |
| Moroccans | 72.9 /100 | #156 | Good 12.1% |
| Danes | 72.5 /100 | #157 | Good 12.1% |
| Immigrants | Middle Africa | 72.4 /100 | #158 | Good 12.1% |
| Immigrants | Central America | 67.7 /100 | #159 | Good 12.1% |
| Immigrants | Guatemala | 66.0 /100 | #160 | Good 12.1% |
| Guyanese | 64.7 /100 | #161 | Good 12.1% |
| Immigrants | Ukraine | 64.3 /100 | #162 | Good 12.1% |
| Guatemalans | 63.8 /100 | #163 | Good 12.1% |
| Czechs | 63.6 /100 | #164 | Good 12.1% |
| Immigrants | Oceania | 61.8 /100 | #165 | Good 12.1% |
| Lithuanians | 59.5 /100 | #166 | Average 12.2% |
| Immigrants | Latin America | 59.0 /100 | #167 | Average 12.2% |
| Immigrants | Haiti | 58.8 /100 | #168 | Average 12.2% |