Belizean vs Alsatian Female Disability
COMPARE
Belizean
Alsatian
Female Disability
Female Disability Comparison
Belizeans
Alsatians
12.5%
FEMALE DISABILITY
9.3/ 100
METRIC RATING
224th/ 347
METRIC RANK
12.6%
FEMALE DISABILITY
2.5/ 100
METRIC RATING
244th/ 347
METRIC RANK
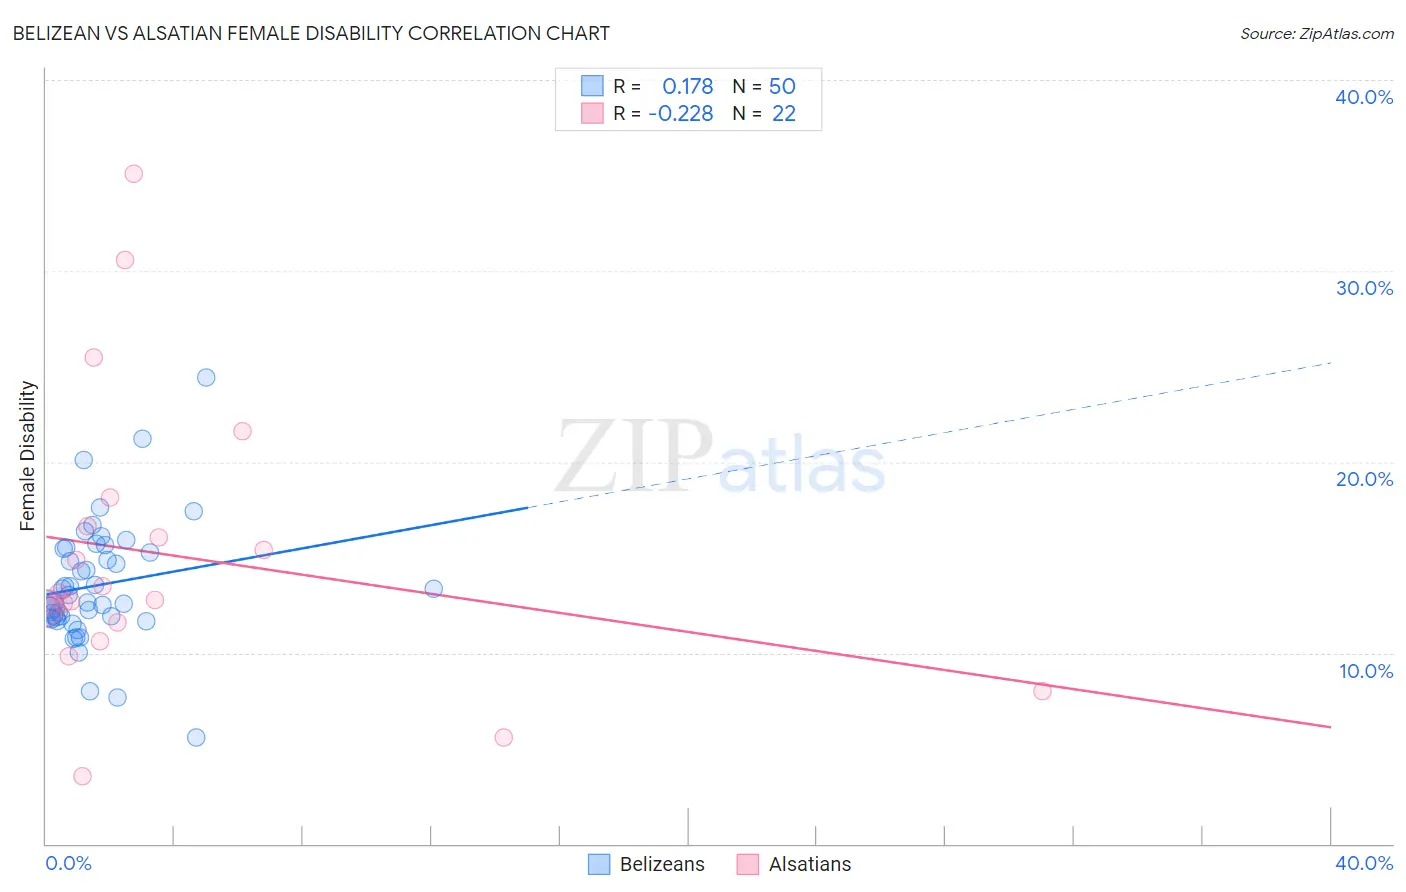
Belizean vs Alsatian Female Disability Correlation Chart
The statistical analysis conducted on geographies consisting of 144,186,476 people shows a poor positive correlation between the proportion of Belizeans and percentage of females with a disability in the United States with a correlation coefficient (R) of 0.178 and weighted average of 12.5%. Similarly, the statistical analysis conducted on geographies consisting of 82,681,470 people shows a weak negative correlation between the proportion of Alsatians and percentage of females with a disability in the United States with a correlation coefficient (R) of -0.228 and weighted average of 12.6%, a difference of 1.3%.
Female Disability Correlation Summary
| Measurement | Belizean | Alsatian |
| Minimum | 5.5% | 3.5% |
| Maximum | 24.4% | 35.1% |
| Range | 18.9% | 31.5% |
| Mean | 13.5% | 15.1% |
| Median | 12.8% | 13.0% |
| Interquartile 25% (IQ1) | 11.8% | 11.6% |
| Interquartile 75% (IQ3) | 15.4% | 16.6% |
| Interquartile Range (IQR) | 3.6% | 5.1% |
| Standard Deviation (Sample) | 3.2% | 7.5% |
| Standard Deviation (Population) | 3.2% | 7.3% |
Demographics Similar to Belizeans and Alsatians by Female Disability
In terms of female disability, the demographic groups most similar to Belizeans are Polish (12.5%, a difference of 0.10%), Hispanic or Latino (12.5%, a difference of 0.15%), Assyrian/Chaldean/Syriac (12.5%, a difference of 0.16%), Immigrants from Cambodia (12.5%, a difference of 0.19%), and Hungarian (12.5%, a difference of 0.26%). Similarly, the demographic groups most similar to Alsatians are Immigrants from Senegal (12.6%, a difference of 0.010%), Canadian (12.6%, a difference of 0.020%), Japanese (12.6%, a difference of 0.070%), German Russian (12.6%, a difference of 0.25%), and Barbadian (12.6%, a difference of 0.34%).
| Demographics | Rating | Rank | Female Disability |
| Belizeans | 9.3 /100 | #224 | Tragic 12.5% |
| Poles | 8.4 /100 | #225 | Tragic 12.5% |
| Hispanics or Latinos | 8.0 /100 | #226 | Tragic 12.5% |
| Assyrians/Chaldeans/Syriacs | 8.0 /100 | #227 | Tragic 12.5% |
| Immigrants | Cambodia | 7.8 /100 | #228 | Tragic 12.5% |
| Hungarians | 7.2 /100 | #229 | Tragic 12.5% |
| Immigrants | Belize | 7.0 /100 | #230 | Tragic 12.5% |
| Belgians | 6.5 /100 | #231 | Tragic 12.5% |
| Immigrants | Somalia | 5.9 /100 | #232 | Tragic 12.5% |
| Immigrants | Iraq | 5.3 /100 | #233 | Tragic 12.5% |
| Scandinavians | 5.3 /100 | #234 | Tragic 12.5% |
| Malaysians | 5.0 /100 | #235 | Tragic 12.5% |
| Immigrants | West Indies | 4.4 /100 | #236 | Tragic 12.6% |
| Slavs | 3.8 /100 | #237 | Tragic 12.6% |
| Yugoslavians | 3.7 /100 | #238 | Tragic 12.6% |
| Barbadians | 3.6 /100 | #239 | Tragic 12.6% |
| German Russians | 3.2 /100 | #240 | Tragic 12.6% |
| Japanese | 2.7 /100 | #241 | Tragic 12.6% |
| Canadians | 2.6 /100 | #242 | Tragic 12.6% |
| Immigrants | Senegal | 2.5 /100 | #243 | Tragic 12.6% |
| Alsatians | 2.5 /100 | #244 | Tragic 12.6% |