Immigrants from Cambodia vs Latvian Vision Disability
COMPARE
Immigrants from Cambodia
Latvian
Vision Disability
Vision Disability Comparison
Immigrants from Cambodia
Latvians
2.3%
VISION DISABILITY
1.1/ 100
METRIC RATING
238th/ 347
METRIC RANK
2.0%
VISION DISABILITY
99.5/ 100
METRIC RATING
49th/ 347
METRIC RANK
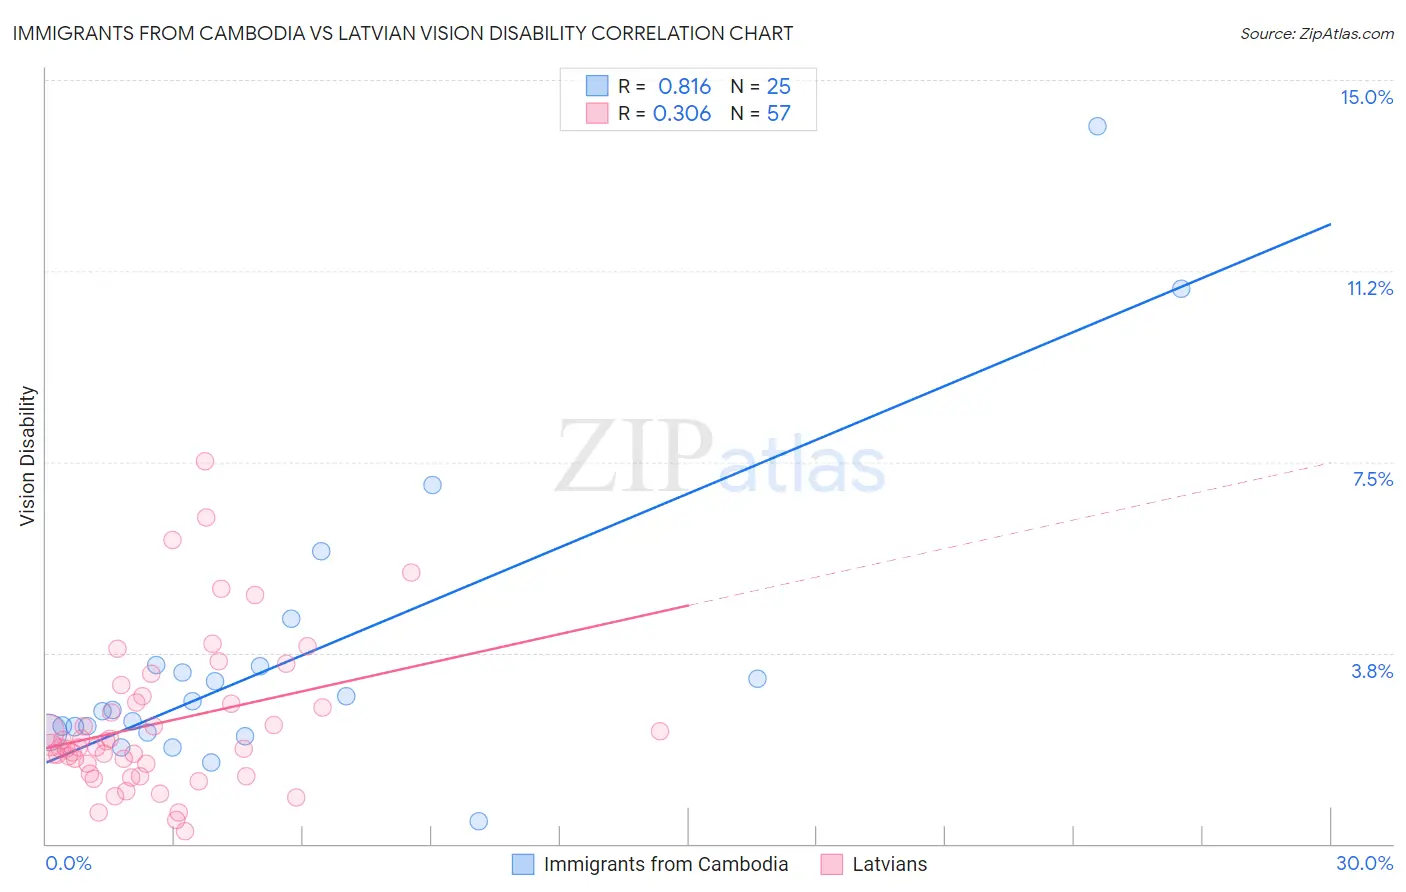
Immigrants from Cambodia vs Latvian Vision Disability Correlation Chart
The statistical analysis conducted on geographies consisting of 205,117,517 people shows a very strong positive correlation between the proportion of Immigrants from Cambodia and percentage of population with vision disability in the United States with a correlation coefficient (R) of 0.816 and weighted average of 2.3%. Similarly, the statistical analysis conducted on geographies consisting of 220,626,631 people shows a mild positive correlation between the proportion of Latvians and percentage of population with vision disability in the United States with a correlation coefficient (R) of 0.306 and weighted average of 2.0%, a difference of 16.9%.
Vision Disability Correlation Summary
| Measurement | Immigrants from Cambodia | Latvian |
| Minimum | 0.43% | 0.25% |
| Maximum | 14.1% | 7.5% |
| Range | 13.7% | 7.3% |
| Mean | 3.7% | 2.4% |
| Median | 2.6% | 1.9% |
| Interquartile 25% (IQ1) | 2.2% | 1.5% |
| Interquartile 75% (IQ3) | 3.5% | 2.8% |
| Interquartile Range (IQR) | 1.3% | 1.3% |
| Standard Deviation (Sample) | 3.0% | 1.5% |
| Standard Deviation (Population) | 2.9% | 1.5% |
Similar Demographics by Vision Disability
Demographics Similar to Immigrants from Cambodia by Vision Disability
In terms of vision disability, the demographic groups most similar to Immigrants from Cambodia are English (2.3%, a difference of 0.020%), Immigrants from Portugal (2.3%, a difference of 0.27%), Panamanian (2.3%, a difference of 0.27%), Malaysian (2.3%, a difference of 0.30%), and Immigrants from Congo (2.3%, a difference of 0.32%).
| Demographics | Rating | Rank | Vision Disability |
| Immigrants | Ecuador | 2.0 /100 | #231 | Tragic 2.3% |
| German Russians | 1.8 /100 | #232 | Tragic 2.3% |
| Central Americans | 1.8 /100 | #233 | Tragic 2.3% |
| Scottish | 1.6 /100 | #234 | Tragic 2.3% |
| Marshallese | 1.5 /100 | #235 | Tragic 2.3% |
| Immigrants | Congo | 1.4 /100 | #236 | Tragic 2.3% |
| Immigrants | Portugal | 1.4 /100 | #237 | Tragic 2.3% |
| Immigrants | Cambodia | 1.1 /100 | #238 | Tragic 2.3% |
| English | 1.1 /100 | #239 | Tragic 2.3% |
| Panamanians | 0.9 /100 | #240 | Tragic 2.3% |
| Malaysians | 0.9 /100 | #241 | Tragic 2.3% |
| Immigrants | Panama | 0.8 /100 | #242 | Tragic 2.3% |
| Immigrants | Nicaragua | 0.6 /100 | #243 | Tragic 2.3% |
| Immigrants | West Indies | 0.6 /100 | #244 | Tragic 2.3% |
| Alsatians | 0.6 /100 | #245 | Tragic 2.3% |
Demographics Similar to Latvians by Vision Disability
In terms of vision disability, the demographic groups most similar to Latvians are Afghan (2.0%, a difference of 0.060%), Israeli (2.0%, a difference of 0.070%), Tongan (2.0%, a difference of 0.15%), Immigrants from Serbia (2.0%, a difference of 0.46%), and Immigrants from Bulgaria (2.0%, a difference of 0.52%).
| Demographics | Rating | Rank | Vision Disability |
| Immigrants | Ethiopia | 99.7 /100 | #42 | Exceptional 2.0% |
| Eastern Europeans | 99.7 /100 | #43 | Exceptional 2.0% |
| Immigrants | Indonesia | 99.7 /100 | #44 | Exceptional 2.0% |
| Ethiopians | 99.7 /100 | #45 | Exceptional 2.0% |
| Immigrants | Sweden | 99.7 /100 | #46 | Exceptional 2.0% |
| Immigrants | Bulgaria | 99.7 /100 | #47 | Exceptional 2.0% |
| Israelis | 99.6 /100 | #48 | Exceptional 2.0% |
| Latvians | 99.5 /100 | #49 | Exceptional 2.0% |
| Afghans | 99.5 /100 | #50 | Exceptional 2.0% |
| Tongans | 99.5 /100 | #51 | Exceptional 2.0% |
| Immigrants | Serbia | 99.4 /100 | #52 | Exceptional 2.0% |
| Immigrants | Belarus | 99.3 /100 | #53 | Exceptional 2.0% |
| Macedonians | 99.3 /100 | #54 | Exceptional 2.0% |
| Laotians | 99.3 /100 | #55 | Exceptional 2.0% |
| Jordanians | 99.2 /100 | #56 | Exceptional 2.0% |