Spanish American vs Latvian Vision Disability
COMPARE
Spanish American
Latvian
Vision Disability
Vision Disability Comparison
Spanish Americans
Latvians
2.9%
VISION DISABILITY
0.0/ 100
METRIC RATING
326th/ 347
METRIC RANK
2.0%
VISION DISABILITY
99.5/ 100
METRIC RATING
49th/ 347
METRIC RANK
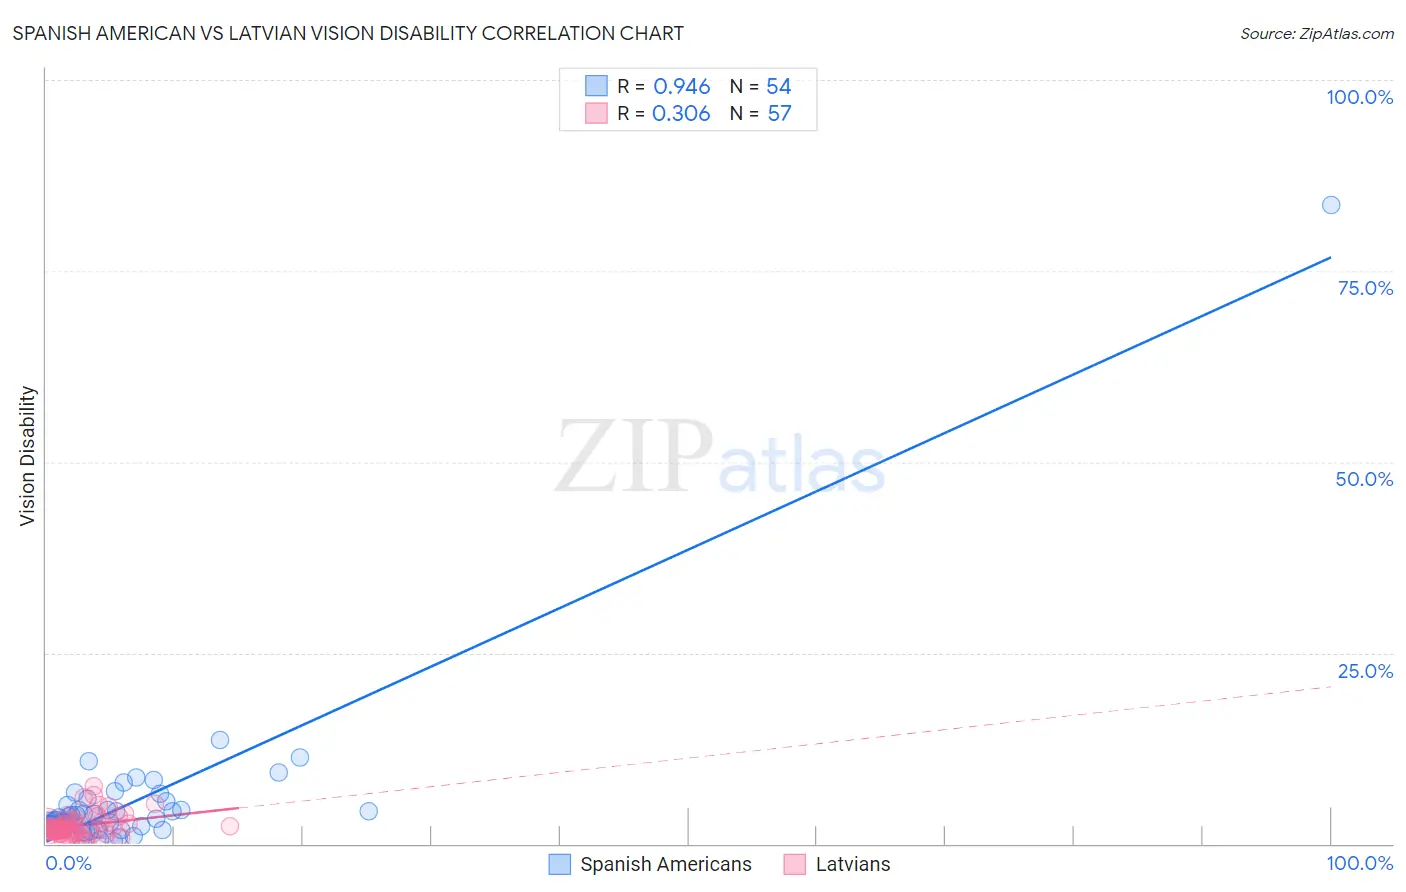
Spanish American vs Latvian Vision Disability Correlation Chart
The statistical analysis conducted on geographies consisting of 103,153,251 people shows a near-perfect positive correlation between the proportion of Spanish Americans and percentage of population with vision disability in the United States with a correlation coefficient (R) of 0.946 and weighted average of 2.9%. Similarly, the statistical analysis conducted on geographies consisting of 220,626,631 people shows a mild positive correlation between the proportion of Latvians and percentage of population with vision disability in the United States with a correlation coefficient (R) of 0.306 and weighted average of 2.0%, a difference of 48.5%.
Vision Disability Correlation Summary
| Measurement | Spanish American | Latvian |
| Minimum | 0.38% | 0.25% |
| Maximum | 83.6% | 7.5% |
| Range | 83.3% | 7.3% |
| Mean | 5.5% | 2.4% |
| Median | 3.3% | 1.9% |
| Interquartile 25% (IQ1) | 2.3% | 1.5% |
| Interquartile 75% (IQ3) | 5.0% | 2.8% |
| Interquartile Range (IQR) | 2.7% | 1.3% |
| Standard Deviation (Sample) | 11.2% | 1.5% |
| Standard Deviation (Population) | 11.1% | 1.5% |
Similar Demographics by Vision Disability
Demographics Similar to Spanish Americans by Vision Disability
In terms of vision disability, the demographic groups most similar to Spanish Americans are Native/Alaskan (3.0%, a difference of 0.80%), Cherokee (2.9%, a difference of 1.2%), Hopi (2.9%, a difference of 1.2%), Yuman (3.0%, a difference of 1.3%), and Apache (3.0%, a difference of 1.5%).
| Demographics | Rating | Rank | Vision Disability |
| Tohono O'odham | 0.0 /100 | #319 | Tragic 2.8% |
| Blacks/African Americans | 0.0 /100 | #320 | Tragic 2.8% |
| Comanche | 0.0 /100 | #321 | Tragic 2.8% |
| Paiute | 0.0 /100 | #322 | Tragic 2.9% |
| Tlingit-Haida | 0.0 /100 | #323 | Tragic 2.9% |
| Hopi | 0.0 /100 | #324 | Tragic 2.9% |
| Cherokee | 0.0 /100 | #325 | Tragic 2.9% |
| Spanish Americans | 0.0 /100 | #326 | Tragic 2.9% |
| Natives/Alaskans | 0.0 /100 | #327 | Tragic 3.0% |
| Yuman | 0.0 /100 | #328 | Tragic 3.0% |
| Apache | 0.0 /100 | #329 | Tragic 3.0% |
| Colville | 0.0 /100 | #330 | Tragic 3.0% |
| Central American Indians | 0.0 /100 | #331 | Tragic 3.0% |
| Seminole | 0.0 /100 | #332 | Tragic 3.1% |
| Cajuns | 0.0 /100 | #333 | Tragic 3.1% |
Demographics Similar to Latvians by Vision Disability
In terms of vision disability, the demographic groups most similar to Latvians are Afghan (2.0%, a difference of 0.060%), Israeli (2.0%, a difference of 0.070%), Tongan (2.0%, a difference of 0.15%), Immigrants from Serbia (2.0%, a difference of 0.46%), and Immigrants from Bulgaria (2.0%, a difference of 0.52%).
| Demographics | Rating | Rank | Vision Disability |
| Immigrants | Ethiopia | 99.7 /100 | #42 | Exceptional 2.0% |
| Eastern Europeans | 99.7 /100 | #43 | Exceptional 2.0% |
| Immigrants | Indonesia | 99.7 /100 | #44 | Exceptional 2.0% |
| Ethiopians | 99.7 /100 | #45 | Exceptional 2.0% |
| Immigrants | Sweden | 99.7 /100 | #46 | Exceptional 2.0% |
| Immigrants | Bulgaria | 99.7 /100 | #47 | Exceptional 2.0% |
| Israelis | 99.6 /100 | #48 | Exceptional 2.0% |
| Latvians | 99.5 /100 | #49 | Exceptional 2.0% |
| Afghans | 99.5 /100 | #50 | Exceptional 2.0% |
| Tongans | 99.5 /100 | #51 | Exceptional 2.0% |
| Immigrants | Serbia | 99.4 /100 | #52 | Exceptional 2.0% |
| Immigrants | Belarus | 99.3 /100 | #53 | Exceptional 2.0% |
| Macedonians | 99.3 /100 | #54 | Exceptional 2.0% |
| Laotians | 99.3 /100 | #55 | Exceptional 2.0% |
| Jordanians | 99.2 /100 | #56 | Exceptional 2.0% |