Belizean vs Arapaho Hearing Disability
COMPARE
Belizean
Arapaho
Hearing Disability
Hearing Disability Comparison
Belizeans
Arapaho
2.8%
HEARING DISABILITY
96.6/ 100
METRIC RATING
89th/ 347
METRIC RANK
4.1%
HEARING DISABILITY
0.0/ 100
METRIC RATING
327th/ 347
METRIC RANK
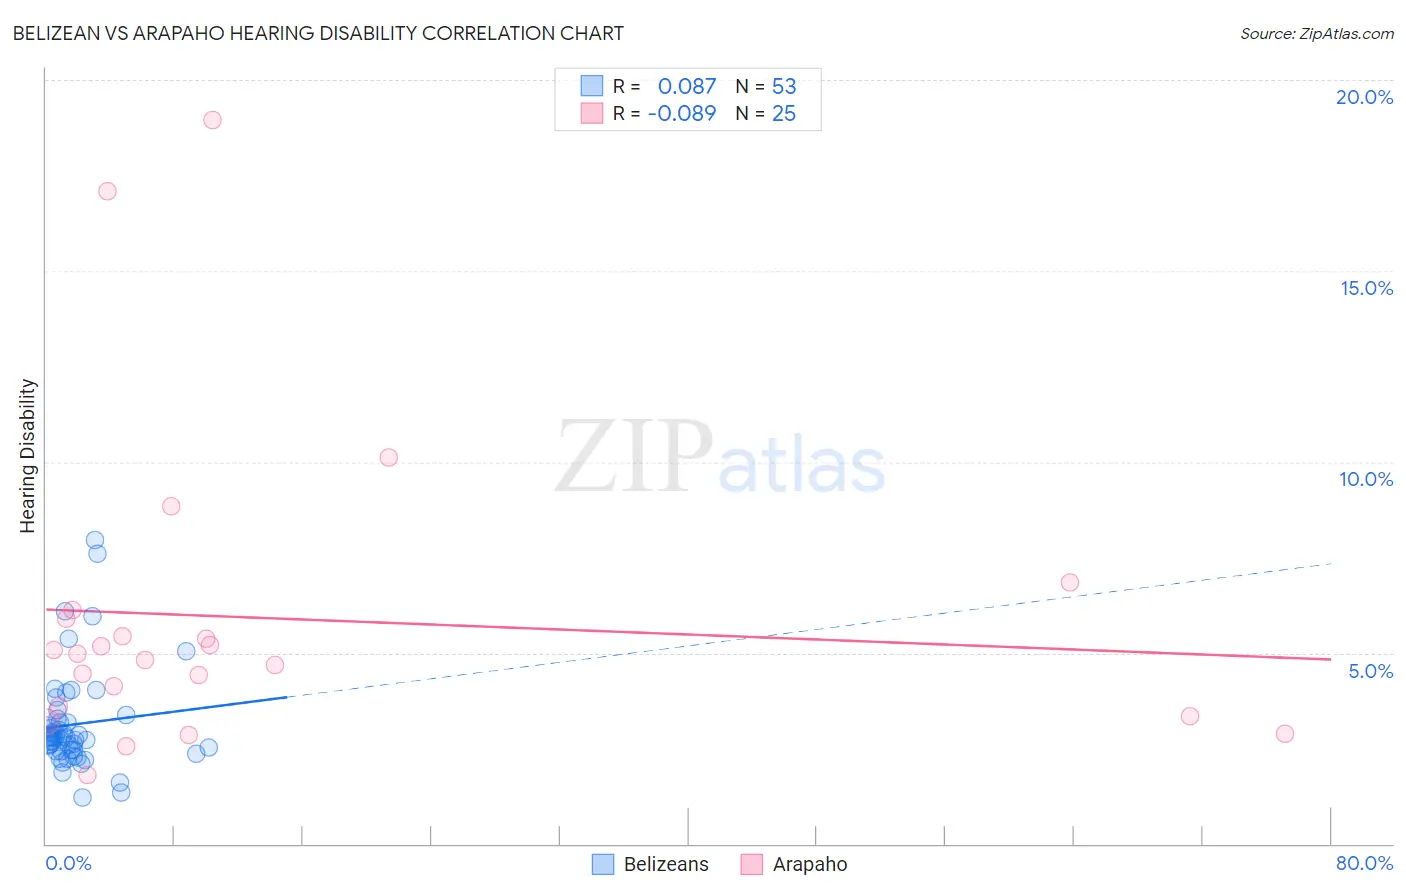
Belizean vs Arapaho Hearing Disability Correlation Chart
The statistical analysis conducted on geographies consisting of 144,164,730 people shows a slight positive correlation between the proportion of Belizeans and percentage of population with hearing disability in the United States with a correlation coefficient (R) of 0.087 and weighted average of 2.8%. Similarly, the statistical analysis conducted on geographies consisting of 29,771,465 people shows a slight negative correlation between the proportion of Arapaho and percentage of population with hearing disability in the United States with a correlation coefficient (R) of -0.089 and weighted average of 4.1%, a difference of 50.4%.
Hearing Disability Correlation Summary
| Measurement | Belizean | Arapaho |
| Minimum | 1.2% | 1.8% |
| Maximum | 8.0% | 19.0% |
| Range | 6.8% | 17.2% |
| Mean | 3.1% | 5.9% |
| Median | 2.8% | 5.0% |
| Interquartile 25% (IQ1) | 2.4% | 3.5% |
| Interquartile 75% (IQ3) | 3.3% | 6.0% |
| Interquartile Range (IQR) | 0.89% | 2.5% |
| Standard Deviation (Sample) | 1.4% | 4.1% |
| Standard Deviation (Population) | 1.3% | 4.0% |
Similar Demographics by Hearing Disability
Demographics Similar to Belizeans by Hearing Disability
In terms of hearing disability, the demographic groups most similar to Belizeans are Immigrants from Turkey (2.8%, a difference of 0.030%), Immigrants from Morocco (2.8%, a difference of 0.030%), Somali (2.8%, a difference of 0.070%), Immigrants from Middle Africa (2.8%, a difference of 0.11%), and Iranian (2.8%, a difference of 0.14%).
| Demographics | Rating | Rank | Hearing Disability |
| Immigrants | Armenia | 97.2 /100 | #82 | Exceptional 2.7% |
| Immigrants | Cuba | 97.2 /100 | #83 | Exceptional 2.7% |
| Immigrants | Argentina | 97.0 /100 | #84 | Exceptional 2.8% |
| Immigrants | Northern Africa | 96.9 /100 | #85 | Exceptional 2.8% |
| Immigrants | Iran | 96.8 /100 | #86 | Exceptional 2.8% |
| Somalis | 96.7 /100 | #87 | Exceptional 2.8% |
| Immigrants | Turkey | 96.7 /100 | #88 | Exceptional 2.8% |
| Belizeans | 96.6 /100 | #89 | Exceptional 2.8% |
| Immigrants | Morocco | 96.6 /100 | #90 | Exceptional 2.8% |
| Immigrants | Middle Africa | 96.5 /100 | #91 | Exceptional 2.8% |
| Iranians | 96.4 /100 | #92 | Exceptional 2.8% |
| Immigrants | Kuwait | 96.3 /100 | #93 | Exceptional 2.8% |
| Uruguayans | 95.9 /100 | #94 | Exceptional 2.8% |
| Israelis | 95.9 /100 | #95 | Exceptional 2.8% |
| Immigrants | Somalia | 95.5 /100 | #96 | Exceptional 2.8% |
Demographics Similar to Arapaho by Hearing Disability
In terms of hearing disability, the demographic groups most similar to Arapaho are Tohono O'odham (4.2%, a difference of 0.38%), Crow (4.2%, a difference of 0.39%), Potawatomi (4.1%, a difference of 0.72%), Lumbee (4.1%, a difference of 1.0%), and Native/Alaskan (4.2%, a difference of 1.2%).
| Demographics | Rating | Rank | Hearing Disability |
| Shoshone | 0.0 /100 | #320 | Tragic 4.0% |
| Paiute | 0.0 /100 | #321 | Tragic 4.1% |
| Seminole | 0.0 /100 | #322 | Tragic 4.1% |
| Apache | 0.0 /100 | #323 | Tragic 4.1% |
| Osage | 0.0 /100 | #324 | Tragic 4.1% |
| Lumbee | 0.0 /100 | #325 | Tragic 4.1% |
| Potawatomi | 0.0 /100 | #326 | Tragic 4.1% |
| Arapaho | 0.0 /100 | #327 | Tragic 4.1% |
| Tohono O'odham | 0.0 /100 | #328 | Tragic 4.2% |
| Crow | 0.0 /100 | #329 | Tragic 4.2% |
| Natives/Alaskans | 0.0 /100 | #330 | Tragic 4.2% |
| Cherokee | 0.0 /100 | #331 | Tragic 4.2% |
| Houma | 0.0 /100 | #332 | Tragic 4.2% |
| Dutch West Indians | 0.0 /100 | #333 | Tragic 4.3% |
| Aleuts | 0.0 /100 | #334 | Tragic 4.3% |