Belizean vs Irish Hearing Disability
COMPARE
Belizean
Irish
Hearing Disability
Hearing Disability Comparison
Belizeans
Irish
2.8%
HEARING DISABILITY
96.6/ 100
METRIC RATING
89th/ 347
METRIC RANK
3.7%
HEARING DISABILITY
0.0/ 100
METRIC RATING
288th/ 347
METRIC RANK
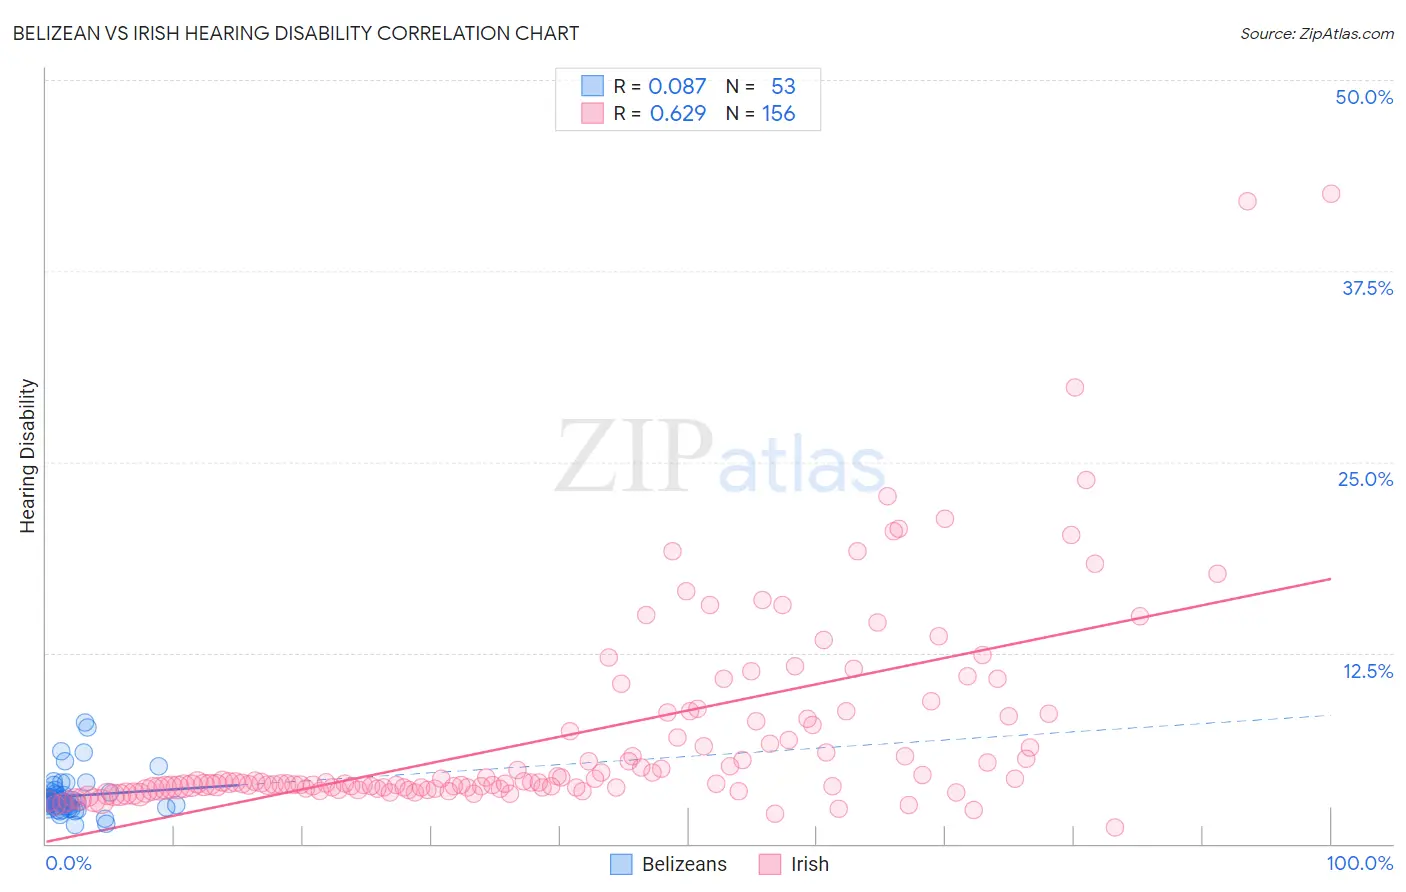
Belizean vs Irish Hearing Disability Correlation Chart
The statistical analysis conducted on geographies consisting of 144,164,730 people shows a slight positive correlation between the proportion of Belizeans and percentage of population with hearing disability in the United States with a correlation coefficient (R) of 0.087 and weighted average of 2.8%. Similarly, the statistical analysis conducted on geographies consisting of 579,581,803 people shows a significant positive correlation between the proportion of Irish and percentage of population with hearing disability in the United States with a correlation coefficient (R) of 0.629 and weighted average of 3.7%, a difference of 33.1%.
Hearing Disability Correlation Summary
| Measurement | Belizean | Irish |
| Minimum | 1.2% | 1.1% |
| Maximum | 8.0% | 42.5% |
| Range | 6.8% | 41.5% |
| Mean | 3.1% | 7.0% |
| Median | 2.8% | 4.0% |
| Interquartile 25% (IQ1) | 2.4% | 3.6% |
| Interquartile 75% (IQ3) | 3.3% | 8.1% |
| Interquartile Range (IQR) | 0.89% | 4.5% |
| Standard Deviation (Sample) | 1.4% | 6.6% |
| Standard Deviation (Population) | 1.3% | 6.6% |
Similar Demographics by Hearing Disability
Demographics Similar to Belizeans by Hearing Disability
In terms of hearing disability, the demographic groups most similar to Belizeans are Immigrants from Turkey (2.8%, a difference of 0.030%), Immigrants from Morocco (2.8%, a difference of 0.030%), Somali (2.8%, a difference of 0.070%), Immigrants from Middle Africa (2.8%, a difference of 0.11%), and Iranian (2.8%, a difference of 0.14%).
| Demographics | Rating | Rank | Hearing Disability |
| Immigrants | Armenia | 97.2 /100 | #82 | Exceptional 2.7% |
| Immigrants | Cuba | 97.2 /100 | #83 | Exceptional 2.7% |
| Immigrants | Argentina | 97.0 /100 | #84 | Exceptional 2.8% |
| Immigrants | Northern Africa | 96.9 /100 | #85 | Exceptional 2.8% |
| Immigrants | Iran | 96.8 /100 | #86 | Exceptional 2.8% |
| Somalis | 96.7 /100 | #87 | Exceptional 2.8% |
| Immigrants | Turkey | 96.7 /100 | #88 | Exceptional 2.8% |
| Belizeans | 96.6 /100 | #89 | Exceptional 2.8% |
| Immigrants | Morocco | 96.6 /100 | #90 | Exceptional 2.8% |
| Immigrants | Middle Africa | 96.5 /100 | #91 | Exceptional 2.8% |
| Iranians | 96.4 /100 | #92 | Exceptional 2.8% |
| Immigrants | Kuwait | 96.3 /100 | #93 | Exceptional 2.8% |
| Uruguayans | 95.9 /100 | #94 | Exceptional 2.8% |
| Israelis | 95.9 /100 | #95 | Exceptional 2.8% |
| Immigrants | Somalia | 95.5 /100 | #96 | Exceptional 2.8% |
Demographics Similar to Irish by Hearing Disability
In terms of hearing disability, the demographic groups most similar to Irish are Chinese (3.7%, a difference of 0.21%), White/Caucasian (3.7%, a difference of 0.34%), Finnish (3.7%, a difference of 0.35%), Native Hawaiian (3.7%, a difference of 0.42%), and Norwegian (3.7%, a difference of 0.48%).
| Demographics | Rating | Rank | Hearing Disability |
| Scandinavians | 0.0 /100 | #281 | Tragic 3.6% |
| Swedes | 0.0 /100 | #282 | Tragic 3.6% |
| Blackfeet | 0.0 /100 | #283 | Tragic 3.6% |
| Immigrants | Micronesia | 0.0 /100 | #284 | Tragic 3.6% |
| Sioux | 0.0 /100 | #285 | Tragic 3.6% |
| Delaware | 0.0 /100 | #286 | Tragic 3.6% |
| Spanish | 0.0 /100 | #287 | Tragic 3.7% |
| Irish | 0.0 /100 | #288 | Tragic 3.7% |
| Chinese | 0.0 /100 | #289 | Tragic 3.7% |
| Whites/Caucasians | 0.0 /100 | #290 | Tragic 3.7% |
| Finns | 0.0 /100 | #291 | Tragic 3.7% |
| Native Hawaiians | 0.0 /100 | #292 | Tragic 3.7% |
| Norwegians | 0.0 /100 | #293 | Tragic 3.7% |
| Iroquois | 0.0 /100 | #294 | Tragic 3.7% |
| Welsh | 0.0 /100 | #295 | Tragic 3.7% |