Guatemalan vs Immigrants from Brazil Disability Age 5 to 17
COMPARE
Guatemalan
Immigrants from Brazil
Disability Age 5 to 17
Disability Age 5 to 17 Comparison
Guatemalans
Immigrants from Brazil
5.5%
DISABILITY AGE 5 TO 17
81.5/ 100
METRIC RATING
150th/ 347
METRIC RANK
5.8%
DISABILITY AGE 5 TO 17
3.2/ 100
METRIC RATING
236th/ 347
METRIC RANK
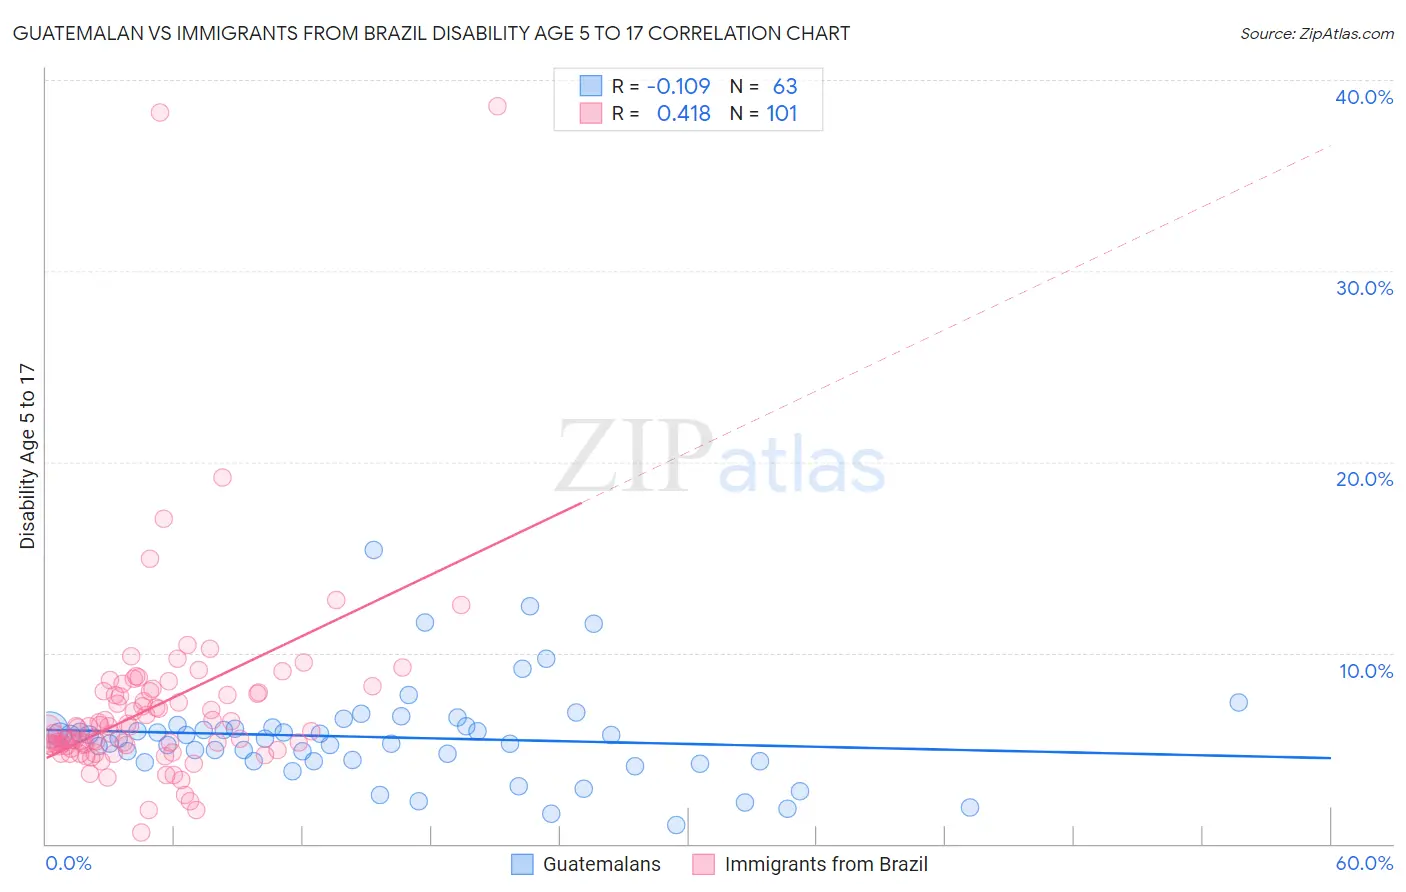
Guatemalan vs Immigrants from Brazil Disability Age 5 to 17 Correlation Chart
The statistical analysis conducted on geographies consisting of 406,988,204 people shows a poor negative correlation between the proportion of Guatemalans and percentage of population with a disability between the ages 5 and 17 in the United States with a correlation coefficient (R) of -0.109 and weighted average of 5.5%. Similarly, the statistical analysis conducted on geographies consisting of 340,728,736 people shows a moderate positive correlation between the proportion of Immigrants from Brazil and percentage of population with a disability between the ages 5 and 17 in the United States with a correlation coefficient (R) of 0.418 and weighted average of 5.8%, a difference of 6.1%.
Disability Age 5 to 17 Correlation Summary
| Measurement | Guatemalan | Immigrants from Brazil |
| Minimum | 0.96% | 0.57% |
| Maximum | 15.4% | 38.7% |
| Range | 14.4% | 38.1% |
| Mean | 5.6% | 7.2% |
| Median | 5.5% | 6.0% |
| Interquartile 25% (IQ1) | 4.3% | 5.1% |
| Interquartile 75% (IQ3) | 6.1% | 8.0% |
| Interquartile Range (IQR) | 1.8% | 2.8% |
| Standard Deviation (Sample) | 2.5% | 5.3% |
| Standard Deviation (Population) | 2.5% | 5.3% |
Similar Demographics by Disability Age 5 to 17
Demographics Similar to Guatemalans by Disability Age 5 to 17
In terms of disability age 5 to 17, the demographic groups most similar to Guatemalans are Central American (5.5%, a difference of 0.0%), Samoan (5.5%, a difference of 0.030%), Estonian (5.5%, a difference of 0.060%), Ute (5.5%, a difference of 0.070%), and Immigrants from Albania (5.5%, a difference of 0.13%).
| Demographics | Rating | Rank | Disability Age 5 to 17 |
| Immigrants | Hungary | 87.9 /100 | #143 | Excellent 5.5% |
| Pakistanis | 87.3 /100 | #144 | Excellent 5.5% |
| Immigrants | Guatemala | 86.6 /100 | #145 | Excellent 5.5% |
| Albanians | 83.7 /100 | #146 | Excellent 5.5% |
| Immigrants | Albania | 83.1 /100 | #147 | Excellent 5.5% |
| Samoans | 81.9 /100 | #148 | Excellent 5.5% |
| Central Americans | 81.6 /100 | #149 | Excellent 5.5% |
| Guatemalans | 81.5 /100 | #150 | Excellent 5.5% |
| Estonians | 80.8 /100 | #151 | Excellent 5.5% |
| Ute | 80.6 /100 | #152 | Excellent 5.5% |
| Ecuadorians | 79.7 /100 | #153 | Good 5.5% |
| Australians | 78.8 /100 | #154 | Good 5.5% |
| Immigrants | Ecuador | 78.3 /100 | #155 | Good 5.5% |
| Hawaiians | 78.0 /100 | #156 | Good 5.5% |
| Immigrants | Costa Rica | 77.9 /100 | #157 | Good 5.5% |
Demographics Similar to Immigrants from Brazil by Disability Age 5 to 17
In terms of disability age 5 to 17, the demographic groups most similar to Immigrants from Brazil are Malaysian (5.8%, a difference of 0.060%), Immigrants from Kenya (5.8%, a difference of 0.070%), Immigrants from West Indies (5.8%, a difference of 0.11%), Sudanese (5.8%, a difference of 0.15%), and Immigrants from Laos (5.8%, a difference of 0.20%).
| Demographics | Rating | Rank | Disability Age 5 to 17 |
| Bangladeshis | 4.8 /100 | #229 | Tragic 5.8% |
| Ghanaians | 4.7 /100 | #230 | Tragic 5.8% |
| Europeans | 4.5 /100 | #231 | Tragic 5.8% |
| Immigrants | Laos | 3.8 /100 | #232 | Tragic 5.8% |
| Immigrants | West Indies | 3.5 /100 | #233 | Tragic 5.8% |
| Immigrants | Kenya | 3.4 /100 | #234 | Tragic 5.8% |
| Malaysians | 3.4 /100 | #235 | Tragic 5.8% |
| Immigrants | Brazil | 3.2 /100 | #236 | Tragic 5.8% |
| Sudanese | 2.9 /100 | #237 | Tragic 5.8% |
| Hungarians | 2.6 /100 | #238 | Tragic 5.8% |
| German Russians | 2.4 /100 | #239 | Tragic 5.9% |
| West Indians | 2.4 /100 | #240 | Tragic 5.9% |
| Immigrants | Caribbean | 2.1 /100 | #241 | Tragic 5.9% |
| Spaniards | 2.0 /100 | #242 | Tragic 5.9% |
| Indonesians | 2.0 /100 | #243 | Tragic 5.9% |