Carpatho Rusyn vs Immigrants from Sierra Leone Hearing Disability
COMPARE
Carpatho Rusyn
Immigrants from Sierra Leone
Hearing Disability
Hearing Disability Comparison
Carpatho Rusyns
Immigrants from Sierra Leone
3.4%
HEARING DISABILITY
0.3/ 100
METRIC RATING
253rd/ 347
METRIC RANK
2.6%
HEARING DISABILITY
99.8/ 100
METRIC RATING
22nd/ 347
METRIC RANK
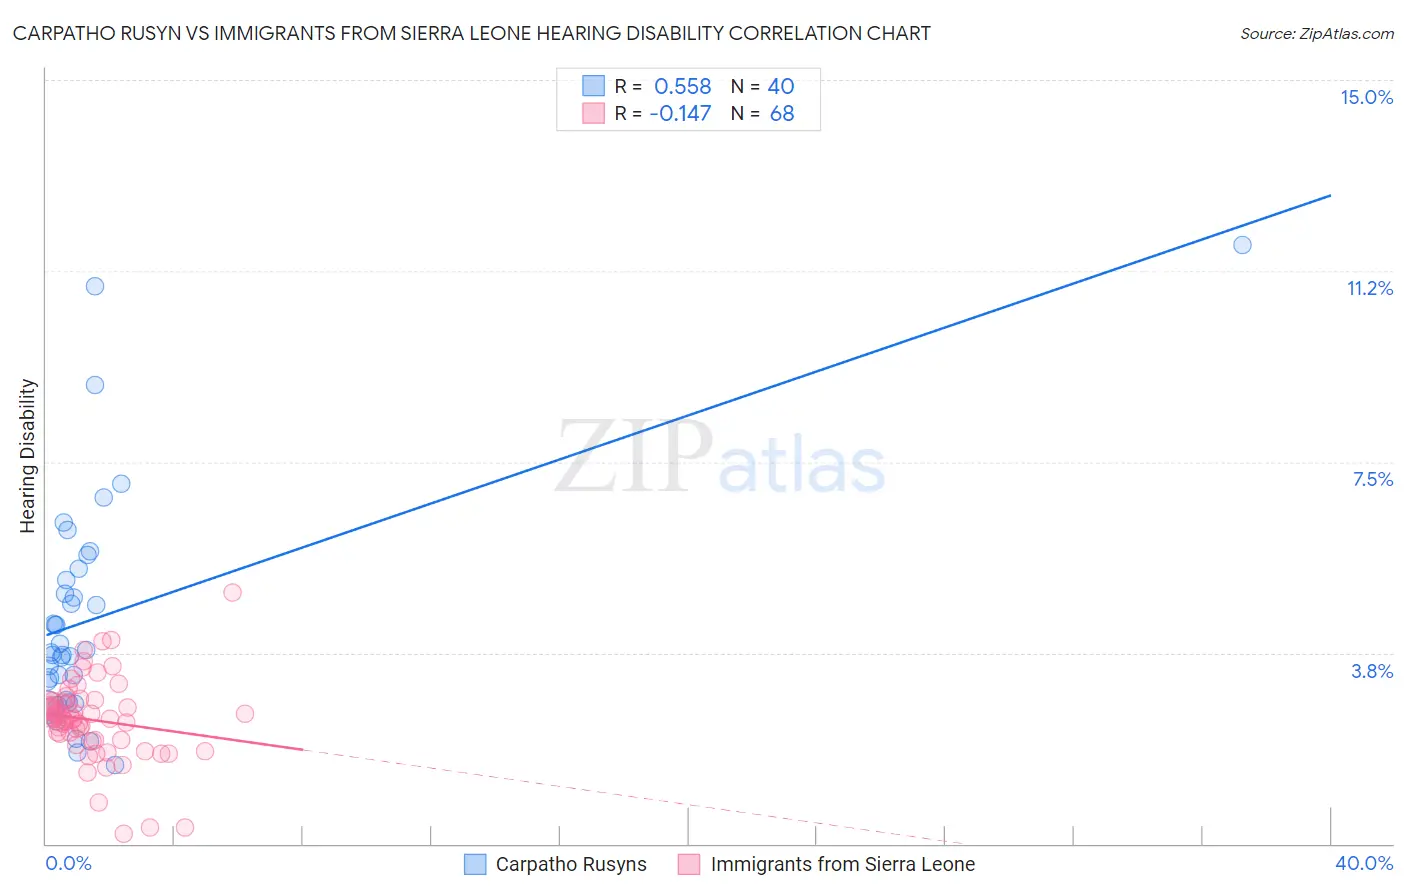
Carpatho Rusyn vs Immigrants from Sierra Leone Hearing Disability Correlation Chart
The statistical analysis conducted on geographies consisting of 58,869,507 people shows a substantial positive correlation between the proportion of Carpatho Rusyns and percentage of population with hearing disability in the United States with a correlation coefficient (R) of 0.558 and weighted average of 3.4%. Similarly, the statistical analysis conducted on geographies consisting of 101,639,141 people shows a poor negative correlation between the proportion of Immigrants from Sierra Leone and percentage of population with hearing disability in the United States with a correlation coefficient (R) of -0.147 and weighted average of 2.6%, a difference of 33.6%.
Hearing Disability Correlation Summary
| Measurement | Carpatho Rusyn | Immigrants from Sierra Leone |
| Minimum | 1.5% | 0.20% |
| Maximum | 11.8% | 4.9% |
| Range | 10.2% | 4.7% |
| Mean | 4.5% | 2.4% |
| Median | 3.8% | 2.5% |
| Interquartile 25% (IQ1) | 3.0% | 2.0% |
| Interquartile 75% (IQ3) | 5.3% | 2.8% |
| Interquartile Range (IQR) | 2.3% | 0.72% |
| Standard Deviation (Sample) | 2.2% | 0.81% |
| Standard Deviation (Population) | 2.2% | 0.80% |
Similar Demographics by Hearing Disability
Demographics Similar to Carpatho Rusyns by Hearing Disability
In terms of hearing disability, the demographic groups most similar to Carpatho Rusyns are Slavic (3.4%, a difference of 0.42%), Croatian (3.4%, a difference of 0.45%), Polish (3.4%, a difference of 0.65%), Hungarian (3.4%, a difference of 0.66%), and Hmong (3.4%, a difference of 0.70%).
| Demographics | Rating | Rank | Hearing Disability |
| Immigrants | England | 0.7 /100 | #246 | Tragic 3.3% |
| Lithuanians | 0.6 /100 | #247 | Tragic 3.4% |
| Austrians | 0.6 /100 | #248 | Tragic 3.4% |
| Italians | 0.4 /100 | #249 | Tragic 3.4% |
| Yuman | 0.4 /100 | #250 | Tragic 3.4% |
| Hungarians | 0.4 /100 | #251 | Tragic 3.4% |
| Croatians | 0.4 /100 | #252 | Tragic 3.4% |
| Carpatho Rusyns | 0.3 /100 | #253 | Tragic 3.4% |
| Slavs | 0.2 /100 | #254 | Tragic 3.4% |
| Poles | 0.2 /100 | #255 | Tragic 3.4% |
| Hmong | 0.2 /100 | #256 | Tragic 3.4% |
| Yaqui | 0.2 /100 | #257 | Tragic 3.4% |
| Northern Europeans | 0.2 /100 | #258 | Tragic 3.4% |
| Slovenes | 0.1 /100 | #259 | Tragic 3.5% |
| Portuguese | 0.1 /100 | #260 | Tragic 3.5% |
Demographics Similar to Immigrants from Sierra Leone by Hearing Disability
In terms of hearing disability, the demographic groups most similar to Immigrants from Sierra Leone are Ghanaian (2.5%, a difference of 0.040%), Immigrants from Bolivia (2.5%, a difference of 0.11%), Thai (2.5%, a difference of 0.16%), Dominican (2.5%, a difference of 0.18%), and Immigrants from Nigeria (2.6%, a difference of 0.50%).
| Demographics | Rating | Rank | Hearing Disability |
| Barbadians | 99.9 /100 | #15 | Exceptional 2.5% |
| Immigrants | West Indies | 99.9 /100 | #16 | Exceptional 2.5% |
| Immigrants | India | 99.9 /100 | #17 | Exceptional 2.5% |
| Dominicans | 99.8 /100 | #18 | Exceptional 2.5% |
| Thais | 99.8 /100 | #19 | Exceptional 2.5% |
| Immigrants | Bolivia | 99.8 /100 | #20 | Exceptional 2.5% |
| Ghanaians | 99.8 /100 | #21 | Exceptional 2.5% |
| Immigrants | Sierra Leone | 99.8 /100 | #22 | Exceptional 2.6% |
| Immigrants | Nigeria | 99.8 /100 | #23 | Exceptional 2.6% |
| Immigrants | Ghana | 99.8 /100 | #24 | Exceptional 2.6% |
| Immigrants | El Salvador | 99.7 /100 | #25 | Exceptional 2.6% |
| Immigrants | Senegal | 99.7 /100 | #26 | Exceptional 2.6% |
| Immigrants | South Central Asia | 99.7 /100 | #27 | Exceptional 2.6% |
| Immigrants | Haiti | 99.7 /100 | #28 | Exceptional 2.6% |
| Bolivians | 99.7 /100 | #29 | Exceptional 2.6% |