Native/Alaskan vs Immigrants from Sierra Leone Hearing Disability
COMPARE
Native/Alaskan
Immigrants from Sierra Leone
Hearing Disability
Hearing Disability Comparison
Natives/Alaskans
Immigrants from Sierra Leone
4.2%
HEARING DISABILITY
0.0/ 100
METRIC RATING
330th/ 347
METRIC RANK
2.6%
HEARING DISABILITY
99.8/ 100
METRIC RATING
22nd/ 347
METRIC RANK
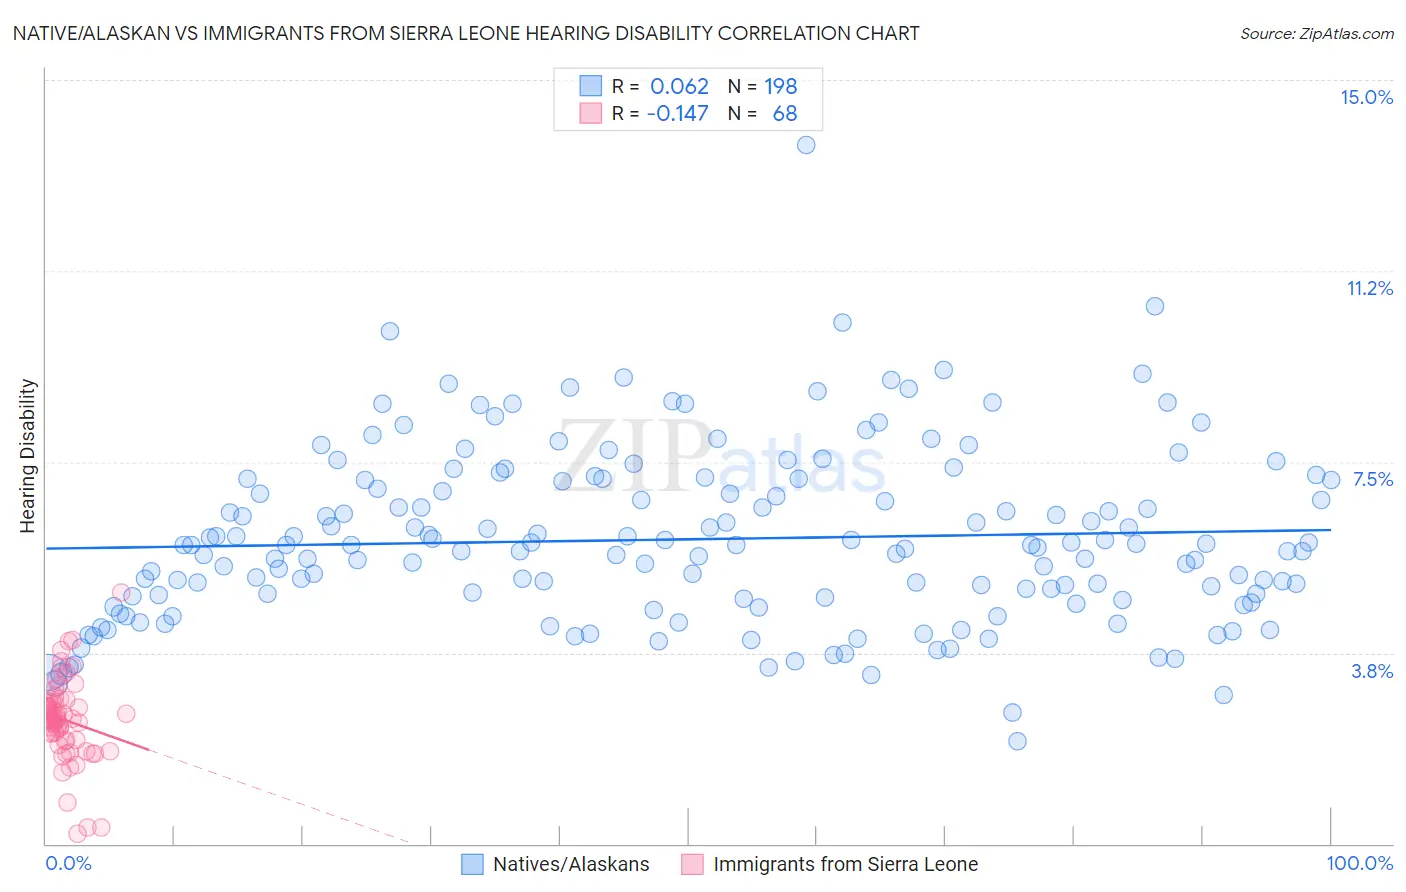
Native/Alaskan vs Immigrants from Sierra Leone Hearing Disability Correlation Chart
The statistical analysis conducted on geographies consisting of 512,663,343 people shows a slight positive correlation between the proportion of Natives/Alaskans and percentage of population with hearing disability in the United States with a correlation coefficient (R) of 0.062 and weighted average of 4.2%. Similarly, the statistical analysis conducted on geographies consisting of 101,639,141 people shows a poor negative correlation between the proportion of Immigrants from Sierra Leone and percentage of population with hearing disability in the United States with a correlation coefficient (R) of -0.147 and weighted average of 2.6%, a difference of 64.6%.
Hearing Disability Correlation Summary
| Measurement | Native/Alaskan | Immigrants from Sierra Leone |
| Minimum | 2.0% | 0.20% |
| Maximum | 13.7% | 4.9% |
| Range | 11.7% | 4.7% |
| Mean | 6.0% | 2.4% |
| Median | 5.9% | 2.5% |
| Interquartile 25% (IQ1) | 4.8% | 2.0% |
| Interquartile 75% (IQ3) | 7.2% | 2.8% |
| Interquartile Range (IQR) | 2.3% | 0.72% |
| Standard Deviation (Sample) | 1.7% | 0.81% |
| Standard Deviation (Population) | 1.7% | 0.80% |
Similar Demographics by Hearing Disability
Demographics Similar to Natives/Alaskans by Hearing Disability
In terms of hearing disability, the demographic groups most similar to Natives/Alaskans are Cherokee (4.2%, a difference of 0.15%), Crow (4.2%, a difference of 0.79%), Tohono O'odham (4.2%, a difference of 0.80%), Houma (4.2%, a difference of 0.83%), and Arapaho (4.1%, a difference of 1.2%).
| Demographics | Rating | Rank | Hearing Disability |
| Apache | 0.0 /100 | #323 | Tragic 4.1% |
| Osage | 0.0 /100 | #324 | Tragic 4.1% |
| Lumbee | 0.0 /100 | #325 | Tragic 4.1% |
| Potawatomi | 0.0 /100 | #326 | Tragic 4.1% |
| Arapaho | 0.0 /100 | #327 | Tragic 4.1% |
| Tohono O'odham | 0.0 /100 | #328 | Tragic 4.2% |
| Crow | 0.0 /100 | #329 | Tragic 4.2% |
| Natives/Alaskans | 0.0 /100 | #330 | Tragic 4.2% |
| Cherokee | 0.0 /100 | #331 | Tragic 4.2% |
| Houma | 0.0 /100 | #332 | Tragic 4.2% |
| Dutch West Indians | 0.0 /100 | #333 | Tragic 4.3% |
| Aleuts | 0.0 /100 | #334 | Tragic 4.3% |
| Kiowa | 0.0 /100 | #335 | Tragic 4.3% |
| Creek | 0.0 /100 | #336 | Tragic 4.4% |
| Chickasaw | 0.0 /100 | #337 | Tragic 4.5% |
Demographics Similar to Immigrants from Sierra Leone by Hearing Disability
In terms of hearing disability, the demographic groups most similar to Immigrants from Sierra Leone are Ghanaian (2.5%, a difference of 0.040%), Immigrants from Bolivia (2.5%, a difference of 0.11%), Thai (2.5%, a difference of 0.16%), Dominican (2.5%, a difference of 0.18%), and Immigrants from Nigeria (2.6%, a difference of 0.50%).
| Demographics | Rating | Rank | Hearing Disability |
| Barbadians | 99.9 /100 | #15 | Exceptional 2.5% |
| Immigrants | West Indies | 99.9 /100 | #16 | Exceptional 2.5% |
| Immigrants | India | 99.9 /100 | #17 | Exceptional 2.5% |
| Dominicans | 99.8 /100 | #18 | Exceptional 2.5% |
| Thais | 99.8 /100 | #19 | Exceptional 2.5% |
| Immigrants | Bolivia | 99.8 /100 | #20 | Exceptional 2.5% |
| Ghanaians | 99.8 /100 | #21 | Exceptional 2.5% |
| Immigrants | Sierra Leone | 99.8 /100 | #22 | Exceptional 2.6% |
| Immigrants | Nigeria | 99.8 /100 | #23 | Exceptional 2.6% |
| Immigrants | Ghana | 99.8 /100 | #24 | Exceptional 2.6% |
| Immigrants | El Salvador | 99.7 /100 | #25 | Exceptional 2.6% |
| Immigrants | Senegal | 99.7 /100 | #26 | Exceptional 2.6% |
| Immigrants | South Central Asia | 99.7 /100 | #27 | Exceptional 2.6% |
| Immigrants | Haiti | 99.7 /100 | #28 | Exceptional 2.6% |
| Bolivians | 99.7 /100 | #29 | Exceptional 2.6% |