Eastern European vs Comanche Disability
COMPARE
Eastern European
Comanche
Disability
Disability Comparison
Eastern Europeans
Comanche
11.2%
DISABILITY
97.8/ 100
METRIC RATING
95th/ 347
METRIC RANK
14.1%
DISABILITY
0.0/ 100
METRIC RATING
323rd/ 347
METRIC RANK
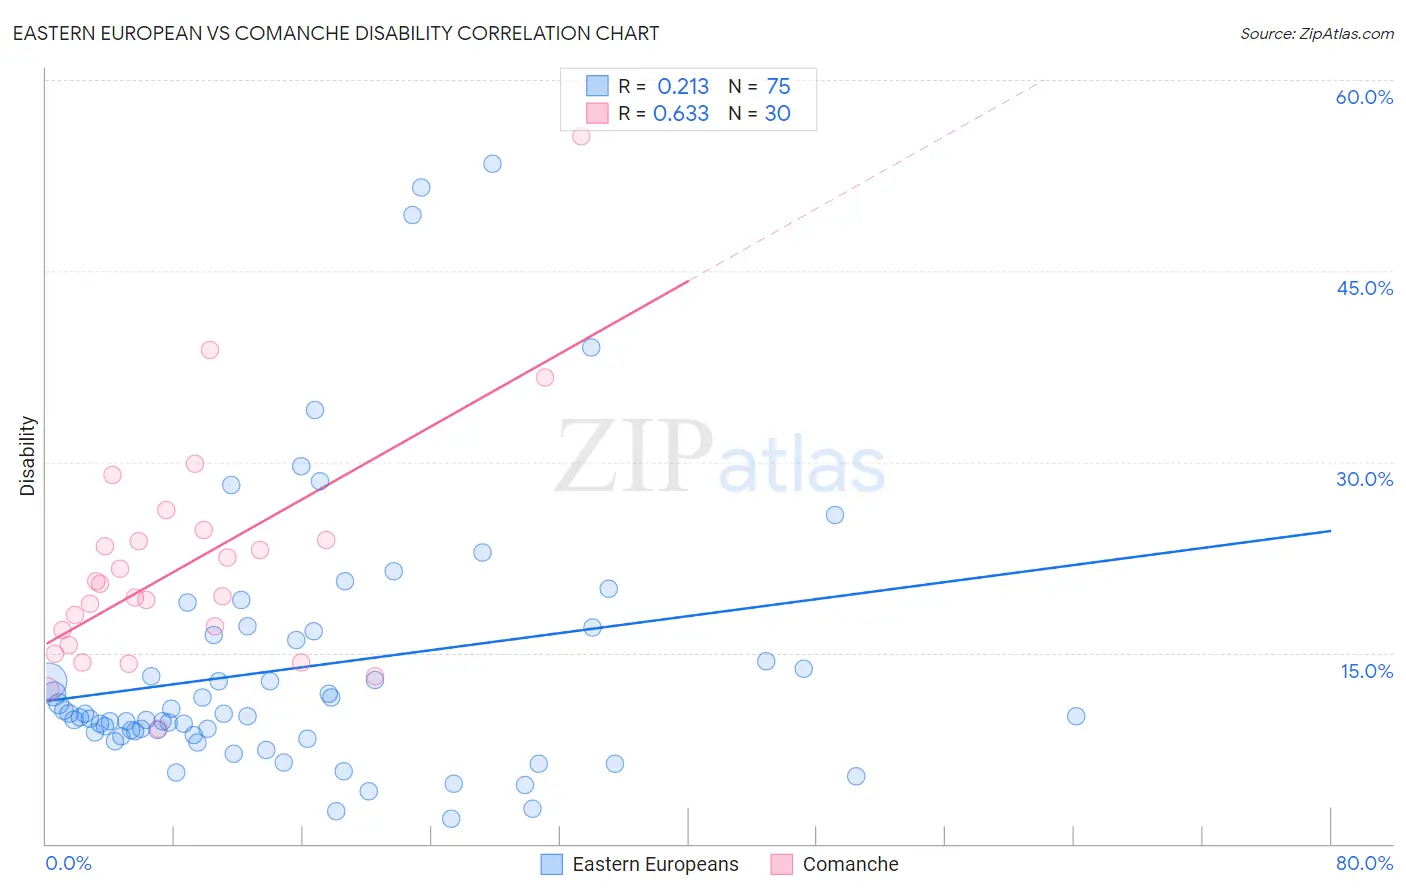
Eastern European vs Comanche Disability Correlation Chart
The statistical analysis conducted on geographies consisting of 461,211,417 people shows a weak positive correlation between the proportion of Eastern Europeans and percentage of population with a disability in the United States with a correlation coefficient (R) of 0.213 and weighted average of 11.2%. Similarly, the statistical analysis conducted on geographies consisting of 109,776,757 people shows a significant positive correlation between the proportion of Comanche and percentage of population with a disability in the United States with a correlation coefficient (R) of 0.633 and weighted average of 14.1%, a difference of 26.0%.
Disability Correlation Summary
| Measurement | Eastern European | Comanche |
| Minimum | 2.0% | 9.0% |
| Maximum | 53.4% | 55.6% |
| Range | 51.5% | 46.5% |
| Mean | 13.9% | 21.9% |
| Median | 10.0% | 19.9% |
| Interquartile 25% (IQ1) | 8.6% | 15.6% |
| Interquartile 75% (IQ3) | 16.4% | 23.8% |
| Interquartile Range (IQR) | 7.9% | 8.3% |
| Standard Deviation (Sample) | 10.5% | 9.3% |
| Standard Deviation (Population) | 10.4% | 9.1% |
Similar Demographics by Disability
Demographics Similar to Eastern Europeans by Disability
In terms of disability, the demographic groups most similar to Eastern Europeans are Immigrants from Morocco (11.2%, a difference of 0.010%), Immigrants from Zimbabwe (11.2%, a difference of 0.060%), Immigrants from Ecuador (11.2%, a difference of 0.12%), Ecuadorian (11.2%, a difference of 0.13%), and Immigrants from Western Asia (11.2%, a difference of 0.16%).
| Demographics | Rating | Rank | Disability |
| Immigrants | Romania | 98.5 /100 | #88 | Exceptional 11.2% |
| Immigrants | South Africa | 98.2 /100 | #89 | Exceptional 11.2% |
| Immigrants | Brazil | 98.1 /100 | #90 | Exceptional 11.2% |
| Immigrants | Western Asia | 98.1 /100 | #91 | Exceptional 11.2% |
| Ecuadorians | 98.0 /100 | #92 | Exceptional 11.2% |
| Immigrants | Ecuador | 98.0 /100 | #93 | Exceptional 11.2% |
| Immigrants | Morocco | 97.8 /100 | #94 | Exceptional 11.2% |
| Eastern Europeans | 97.8 /100 | #95 | Exceptional 11.2% |
| Immigrants | Zimbabwe | 97.7 /100 | #96 | Exceptional 11.2% |
| Bhutanese | 97.4 /100 | #97 | Exceptional 11.2% |
| Uruguayans | 97.4 /100 | #98 | Exceptional 11.2% |
| Immigrants | Czechoslovakia | 97.4 /100 | #99 | Exceptional 11.2% |
| Immigrants | Greece | 96.9 /100 | #100 | Exceptional 11.3% |
| Immigrants | Nicaragua | 96.8 /100 | #101 | Exceptional 11.3% |
| Immigrants | Eastern Africa | 96.7 /100 | #102 | Exceptional 11.3% |
Demographics Similar to Comanche by Disability
In terms of disability, the demographic groups most similar to Comanche are Chippewa (14.1%, a difference of 0.20%), Native/Alaskan (14.2%, a difference of 0.25%), Osage (14.2%, a difference of 0.28%), Ottawa (14.2%, a difference of 0.30%), and Immigrants from the Azores (14.2%, a difference of 0.30%).
| Demographics | Rating | Rank | Disability |
| Pima | 0.0 /100 | #316 | Tragic 13.7% |
| Immigrants | Cabo Verde | 0.0 /100 | #317 | Tragic 13.7% |
| Menominee | 0.0 /100 | #318 | Tragic 13.8% |
| Iroquois | 0.0 /100 | #319 | Tragic 13.8% |
| Apache | 0.0 /100 | #320 | Tragic 13.9% |
| Paiute | 0.0 /100 | #321 | Tragic 13.9% |
| Americans | 0.0 /100 | #322 | Tragic 13.9% |
| Comanche | 0.0 /100 | #323 | Tragic 14.1% |
| Chippewa | 0.0 /100 | #324 | Tragic 14.1% |
| Natives/Alaskans | 0.0 /100 | #325 | Tragic 14.2% |
| Osage | 0.0 /100 | #326 | Tragic 14.2% |
| Ottawa | 0.0 /100 | #327 | Tragic 14.2% |
| Immigrants | Azores | 0.0 /100 | #328 | Tragic 14.2% |
| Potawatomi | 0.0 /100 | #329 | Tragic 14.2% |
| Navajo | 0.0 /100 | #330 | Tragic 14.3% |