Bangladeshi vs Comanche Disability
COMPARE
Bangladeshi
Comanche
Disability
Disability Comparison
Bangladeshis
Comanche
12.6%
DISABILITY
0.1/ 100
METRIC RATING
268th/ 347
METRIC RANK
14.1%
DISABILITY
0.0/ 100
METRIC RATING
323rd/ 347
METRIC RANK
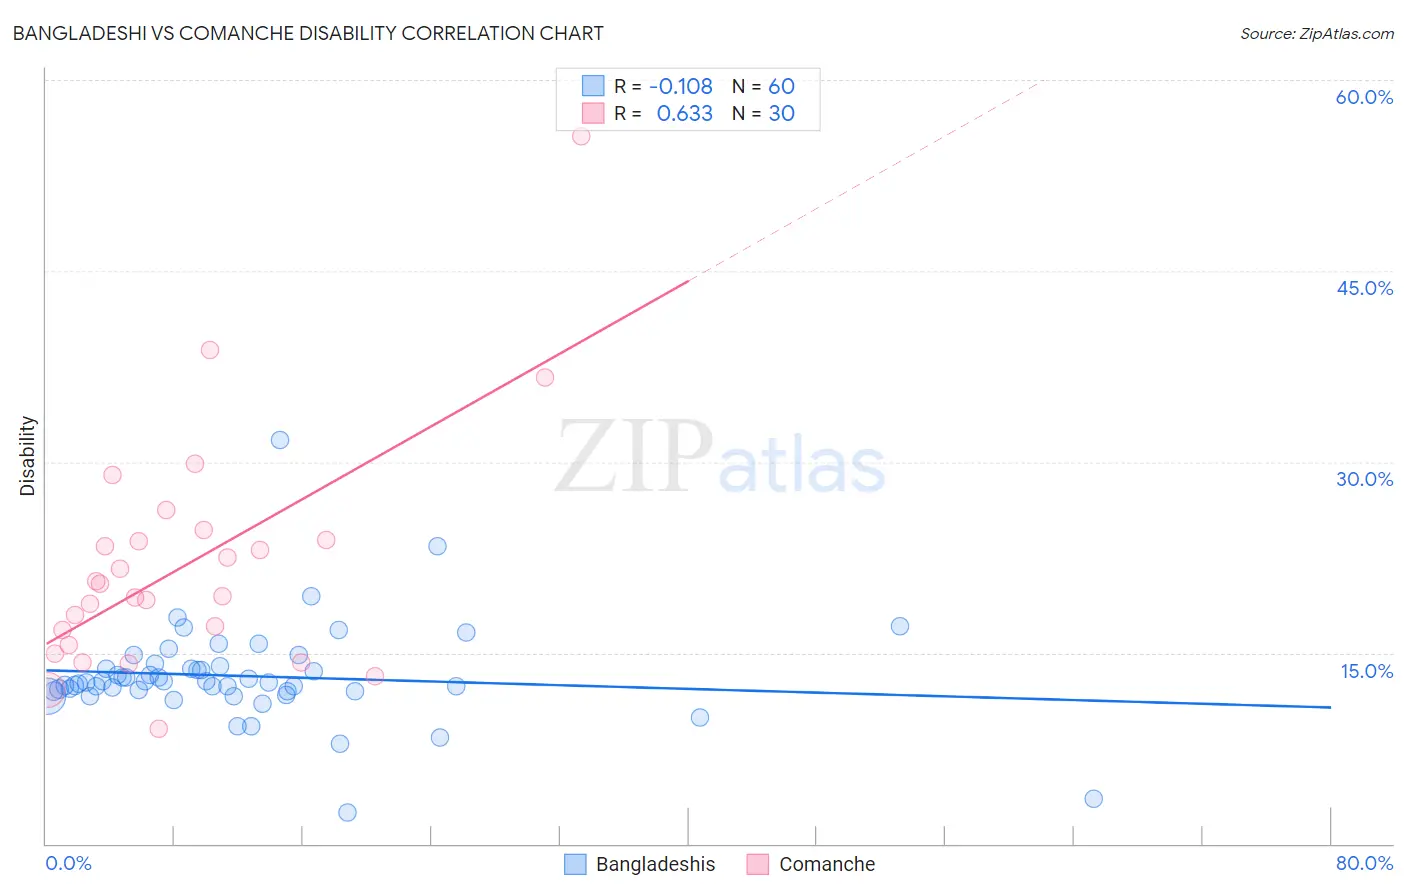
Bangladeshi vs Comanche Disability Correlation Chart
The statistical analysis conducted on geographies consisting of 141,399,990 people shows a poor negative correlation between the proportion of Bangladeshis and percentage of population with a disability in the United States with a correlation coefficient (R) of -0.108 and weighted average of 12.6%. Similarly, the statistical analysis conducted on geographies consisting of 109,776,757 people shows a significant positive correlation between the proportion of Comanche and percentage of population with a disability in the United States with a correlation coefficient (R) of 0.633 and weighted average of 14.1%, a difference of 12.4%.
Disability Correlation Summary
| Measurement | Bangladeshi | Comanche |
| Minimum | 2.4% | 9.0% |
| Maximum | 31.8% | 55.6% |
| Range | 29.3% | 46.5% |
| Mean | 13.2% | 21.9% |
| Median | 12.7% | 19.9% |
| Interquartile 25% (IQ1) | 12.0% | 15.6% |
| Interquartile 75% (IQ3) | 13.8% | 23.8% |
| Interquartile Range (IQR) | 1.8% | 8.3% |
| Standard Deviation (Sample) | 4.0% | 9.3% |
| Standard Deviation (Population) | 3.9% | 9.1% |
Similar Demographics by Disability
Demographics Similar to Bangladeshis by Disability
In terms of disability, the demographic groups most similar to Bangladeshis are Immigrants from Dominican Republic (12.6%, a difference of 0.090%), Spaniard (12.5%, a difference of 0.33%), Czechoslovakian (12.5%, a difference of 0.40%), Portuguese (12.6%, a difference of 0.48%), and Immigrants from Yemen (12.6%, a difference of 0.53%).
| Demographics | Rating | Rank | Disability |
| Scandinavians | 0.4 /100 | #261 | Tragic 12.4% |
| Native Hawaiians | 0.3 /100 | #262 | Tragic 12.5% |
| Hawaiians | 0.2 /100 | #263 | Tragic 12.5% |
| Immigrants | Germany | 0.2 /100 | #264 | Tragic 12.5% |
| U.S. Virgin Islanders | 0.2 /100 | #265 | Tragic 12.5% |
| Czechoslovakians | 0.2 /100 | #266 | Tragic 12.5% |
| Spaniards | 0.2 /100 | #267 | Tragic 12.5% |
| Bangladeshis | 0.1 /100 | #268 | Tragic 12.6% |
| Immigrants | Dominican Republic | 0.1 /100 | #269 | Tragic 12.6% |
| Portuguese | 0.1 /100 | #270 | Tragic 12.6% |
| Immigrants | Yemen | 0.1 /100 | #271 | Tragic 12.6% |
| Dominicans | 0.0 /100 | #272 | Tragic 12.7% |
| Finns | 0.0 /100 | #273 | Tragic 12.7% |
| Nepalese | 0.0 /100 | #274 | Tragic 12.8% |
| Sioux | 0.0 /100 | #275 | Tragic 12.8% |
Demographics Similar to Comanche by Disability
In terms of disability, the demographic groups most similar to Comanche are Chippewa (14.1%, a difference of 0.20%), Native/Alaskan (14.2%, a difference of 0.25%), Osage (14.2%, a difference of 0.28%), Ottawa (14.2%, a difference of 0.30%), and Immigrants from the Azores (14.2%, a difference of 0.30%).
| Demographics | Rating | Rank | Disability |
| Pima | 0.0 /100 | #316 | Tragic 13.7% |
| Immigrants | Cabo Verde | 0.0 /100 | #317 | Tragic 13.7% |
| Menominee | 0.0 /100 | #318 | Tragic 13.8% |
| Iroquois | 0.0 /100 | #319 | Tragic 13.8% |
| Apache | 0.0 /100 | #320 | Tragic 13.9% |
| Paiute | 0.0 /100 | #321 | Tragic 13.9% |
| Americans | 0.0 /100 | #322 | Tragic 13.9% |
| Comanche | 0.0 /100 | #323 | Tragic 14.1% |
| Chippewa | 0.0 /100 | #324 | Tragic 14.1% |
| Natives/Alaskans | 0.0 /100 | #325 | Tragic 14.2% |
| Osage | 0.0 /100 | #326 | Tragic 14.2% |
| Ottawa | 0.0 /100 | #327 | Tragic 14.2% |
| Immigrants | Azores | 0.0 /100 | #328 | Tragic 14.2% |
| Potawatomi | 0.0 /100 | #329 | Tragic 14.2% |
| Navajo | 0.0 /100 | #330 | Tragic 14.3% |