Barbadian vs Comanche Receiving Food Stamps
COMPARE
Barbadian
Comanche
Receiving Food Stamps
Receiving Food Stamps Comparison
Barbadians
Comanche
16.5%
RECEIVING FOOD STAMPS
0.0/ 100
METRIC RATING
308th/ 347
METRIC RANK
13.3%
RECEIVING FOOD STAMPS
2.4/ 100
METRIC RATING
234th/ 347
METRIC RANK
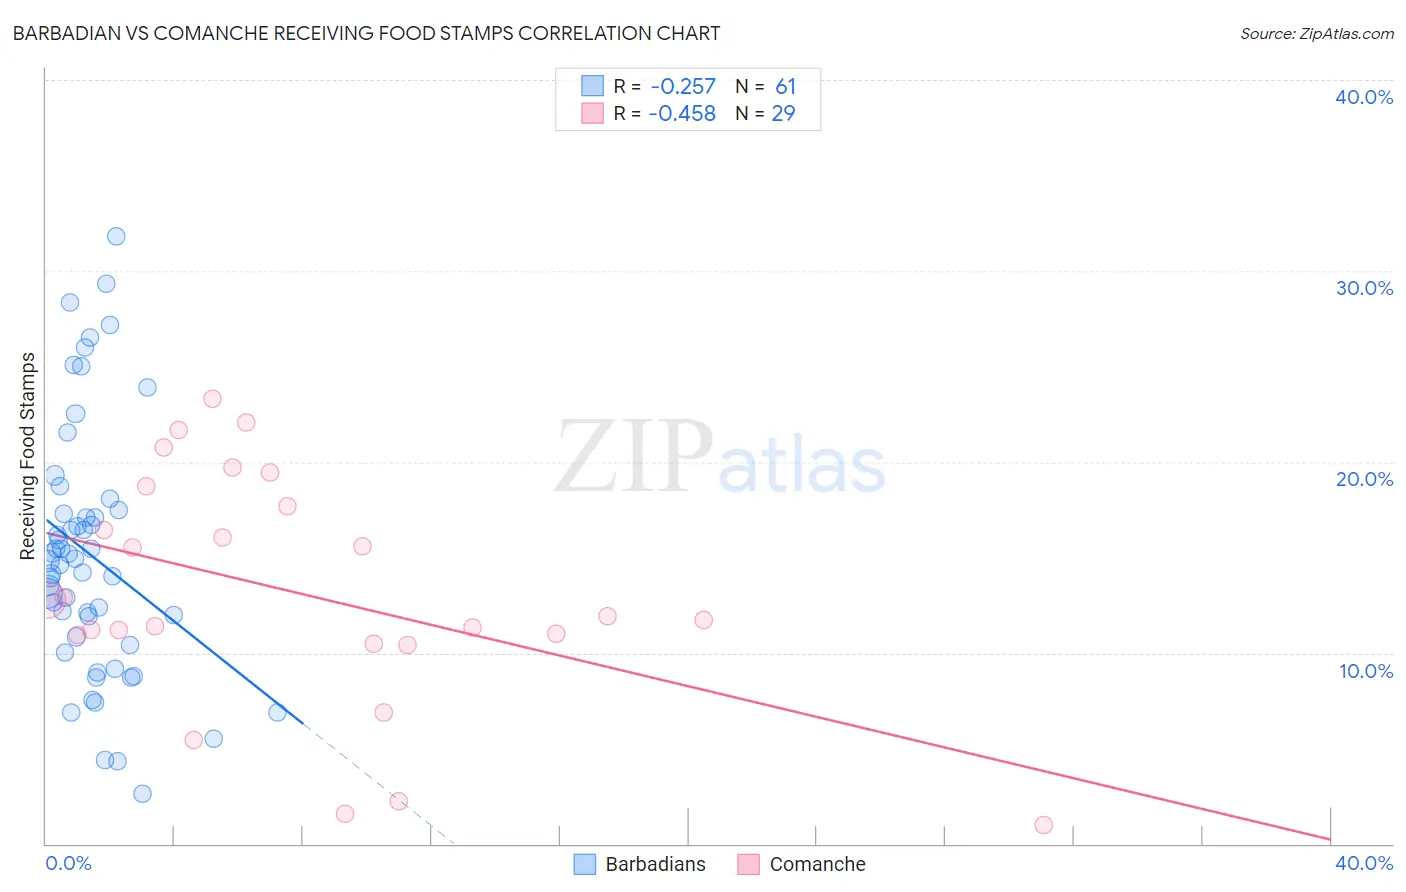
Barbadian vs Comanche Receiving Food Stamps Correlation Chart
The statistical analysis conducted on geographies consisting of 141,159,884 people shows a weak negative correlation between the proportion of Barbadians and percentage of population receiving government assistance and/or food stamps in the United States with a correlation coefficient (R) of -0.257 and weighted average of 16.5%. Similarly, the statistical analysis conducted on geographies consisting of 109,741,835 people shows a moderate negative correlation between the proportion of Comanche and percentage of population receiving government assistance and/or food stamps in the United States with a correlation coefficient (R) of -0.458 and weighted average of 13.3%, a difference of 24.4%.
Receiving Food Stamps Correlation Summary
| Measurement | Barbadian | Comanche |
| Minimum | 2.6% | 1.0% |
| Maximum | 31.8% | 23.3% |
| Range | 29.2% | 22.3% |
| Mean | 15.1% | 13.1% |
| Median | 14.8% | 11.9% |
| Interquartile 25% (IQ1) | 10.6% | 10.7% |
| Interquartile 75% (IQ3) | 17.4% | 18.2% |
| Interquartile Range (IQR) | 6.8% | 7.5% |
| Standard Deviation (Sample) | 6.5% | 6.0% |
| Standard Deviation (Population) | 6.5% | 5.9% |
Similar Demographics by Receiving Food Stamps
Demographics Similar to Barbadians by Receiving Food Stamps
In terms of receiving food stamps, the demographic groups most similar to Barbadians are U.S. Virgin Islander (16.5%, a difference of 0.24%), Houma (16.5%, a difference of 0.26%), Jamaican (16.4%, a difference of 0.55%), Immigrants from the Azores (16.4%, a difference of 0.62%), and Immigrants from Barbados (16.6%, a difference of 0.79%).
| Demographics | Rating | Rank | Receiving Food Stamps |
| Trinidadians and Tobagonians | 0.0 /100 | #301 | Tragic 16.0% |
| Immigrants | West Indies | 0.0 /100 | #302 | Tragic 16.1% |
| Nicaraguans | 0.0 /100 | #303 | Tragic 16.1% |
| West Indians | 0.0 /100 | #304 | Tragic 16.3% |
| Immigrants | Azores | 0.0 /100 | #305 | Tragic 16.4% |
| Jamaicans | 0.0 /100 | #306 | Tragic 16.4% |
| Houma | 0.0 /100 | #307 | Tragic 16.5% |
| Barbadians | 0.0 /100 | #308 | Tragic 16.5% |
| U.S. Virgin Islanders | 0.0 /100 | #309 | Tragic 16.5% |
| Immigrants | Barbados | 0.0 /100 | #310 | Tragic 16.6% |
| Guyanese | 0.0 /100 | #311 | Tragic 16.7% |
| Sioux | 0.0 /100 | #312 | Tragic 16.8% |
| Immigrants | Jamaica | 0.0 /100 | #313 | Tragic 16.9% |
| Immigrants | Guyana | 0.0 /100 | #314 | Tragic 16.9% |
| Bahamians | 0.0 /100 | #315 | Tragic 17.0% |
Demographics Similar to Comanche by Receiving Food Stamps
In terms of receiving food stamps, the demographic groups most similar to Comanche are Cherokee (13.2%, a difference of 0.13%), Salvadoran (13.2%, a difference of 0.38%), Immigrants from Zaire (13.4%, a difference of 0.77%), Immigrants from Nigeria (13.1%, a difference of 1.1%), and Puget Sound Salish (13.1%, a difference of 1.1%).
| Demographics | Rating | Rank | Receiving Food Stamps |
| Nigerians | 3.5 /100 | #227 | Tragic 13.1% |
| Panamanians | 3.5 /100 | #228 | Tragic 13.1% |
| Ottawa | 3.5 /100 | #229 | Tragic 13.1% |
| Puget Sound Salish | 3.4 /100 | #230 | Tragic 13.1% |
| Immigrants | Nigeria | 3.4 /100 | #231 | Tragic 13.1% |
| Salvadorans | 2.7 /100 | #232 | Tragic 13.2% |
| Cherokee | 2.5 /100 | #233 | Tragic 13.2% |
| Comanche | 2.4 /100 | #234 | Tragic 13.3% |
| Immigrants | Zaire | 1.9 /100 | #235 | Tragic 13.4% |
| Crow | 1.6 /100 | #236 | Tragic 13.4% |
| Immigrants | El Salvador | 1.5 /100 | #237 | Tragic 13.5% |
| French American Indians | 1.4 /100 | #238 | Tragic 13.5% |
| Immigrants | Micronesia | 1.3 /100 | #239 | Tragic 13.5% |
| Iroquois | 1.2 /100 | #240 | Tragic 13.5% |
| Choctaw | 1.0 /100 | #241 | Tragic 13.6% |