Austrian vs Syrian College, 1 year or more
COMPARE
Austrian
Syrian
College, 1 year or more
College, 1 year or more Comparison
Austrians
Syrians
61.8%
COLLEGE, 1 YEAR OR MORE
95.4/ 100
METRIC RATING
112th/ 347
METRIC RANK
61.9%
COLLEGE, 1 YEAR OR MORE
95.7/ 100
METRIC RATING
108th/ 347
METRIC RANK
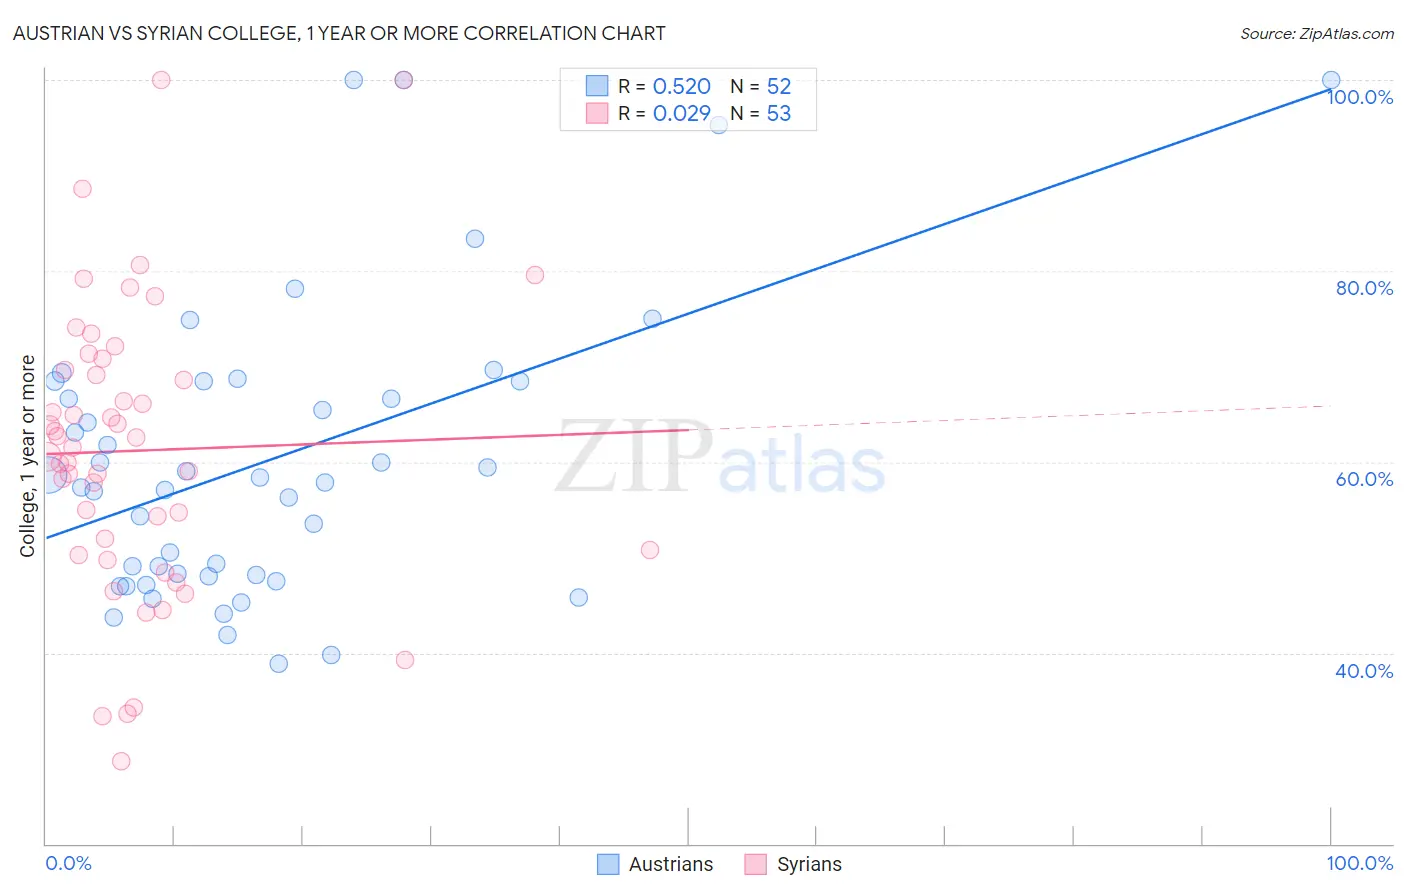
Austrian vs Syrian College, 1 year or more Correlation Chart
The statistical analysis conducted on geographies consisting of 452,079,126 people shows a substantial positive correlation between the proportion of Austrians and percentage of population with at least college, 1 year or more education in the United States with a correlation coefficient (R) of 0.520 and weighted average of 61.8%. Similarly, the statistical analysis conducted on geographies consisting of 266,306,496 people shows no correlation between the proportion of Syrians and percentage of population with at least college, 1 year or more education in the United States with a correlation coefficient (R) of 0.029 and weighted average of 61.9%, a difference of 0.080%.
College, 1 year or more Correlation Summary
| Measurement | Austrian | Syrian |
| Minimum | 38.8% | 28.6% |
| Maximum | 100.0% | 100.0% |
| Range | 61.2% | 71.4% |
| Mean | 60.2% | 61.2% |
| Median | 58.1% | 61.5% |
| Interquartile 25% (IQ1) | 48.1% | 50.5% |
| Interquartile 75% (IQ3) | 68.4% | 70.2% |
| Interquartile Range (IQR) | 20.3% | 19.7% |
| Standard Deviation (Sample) | 15.3% | 15.2% |
| Standard Deviation (Population) | 15.2% | 15.1% |
Demographics Similar to Austrians and Syrians by College, 1 year or more
In terms of college, 1 year or more, the demographic groups most similar to Austrians are European (61.8%, a difference of 0.060%), Macedonian (61.8%, a difference of 0.060%), Ukrainian (61.8%, a difference of 0.070%), Immigrants from Northern Africa (61.9%, a difference of 0.080%), and Immigrants from Ukraine (61.9%, a difference of 0.10%). Similarly, the demographic groups most similar to Syrians are Immigrants from Northern Africa (61.9%, a difference of 0.0%), Immigrants from Ukraine (61.9%, a difference of 0.020%), European (61.8%, a difference of 0.020%), Macedonian (61.8%, a difference of 0.020%), and Ukrainian (61.8%, a difference of 0.15%).
| Demographics | Rating | Rank | College, 1 year or more |
| Icelanders | 96.8 /100 | #100 | Exceptional 62.1% |
| Swedes | 96.8 /100 | #101 | Exceptional 62.1% |
| Luxembourgers | 96.7 /100 | #102 | Exceptional 62.1% |
| Afghans | 96.4 /100 | #103 | Exceptional 62.0% |
| Chileans | 96.4 /100 | #104 | Exceptional 62.0% |
| Immigrants | Nepal | 96.3 /100 | #105 | Exceptional 62.0% |
| Palestinians | 96.3 /100 | #106 | Exceptional 62.0% |
| Immigrants | Ukraine | 95.8 /100 | #107 | Exceptional 61.9% |
| Syrians | 95.7 /100 | #108 | Exceptional 61.9% |
| Immigrants | Northern Africa | 95.7 /100 | #109 | Exceptional 61.9% |
| Europeans | 95.6 /100 | #110 | Exceptional 61.8% |
| Macedonians | 95.6 /100 | #111 | Exceptional 61.8% |
| Austrians | 95.4 /100 | #112 | Exceptional 61.8% |
| Ukrainians | 95.2 /100 | #113 | Exceptional 61.8% |
| Danes | 94.8 /100 | #114 | Exceptional 61.7% |
| Norwegians | 94.5 /100 | #115 | Exceptional 61.7% |
| Lebanese | 94.1 /100 | #116 | Exceptional 61.6% |
| Arabs | 93.9 /100 | #117 | Exceptional 61.6% |
| Immigrants | Brazil | 93.9 /100 | #118 | Exceptional 61.6% |
| Assyrians/Chaldeans/Syriacs | 93.3 /100 | #119 | Exceptional 61.5% |
| Pakistanis | 93.2 /100 | #120 | Exceptional 61.5% |