Austrian vs Immigrants from Poland Disability
COMPARE
Austrian
Immigrants from Poland
Disability
Disability Comparison
Austrians
Immigrants from Poland
12.0%
DISABILITY
7.2/ 100
METRIC RATING
212th/ 347
METRIC RANK
11.1%
DISABILITY
99.1/ 100
METRIC RATING
81st/ 347
METRIC RANK
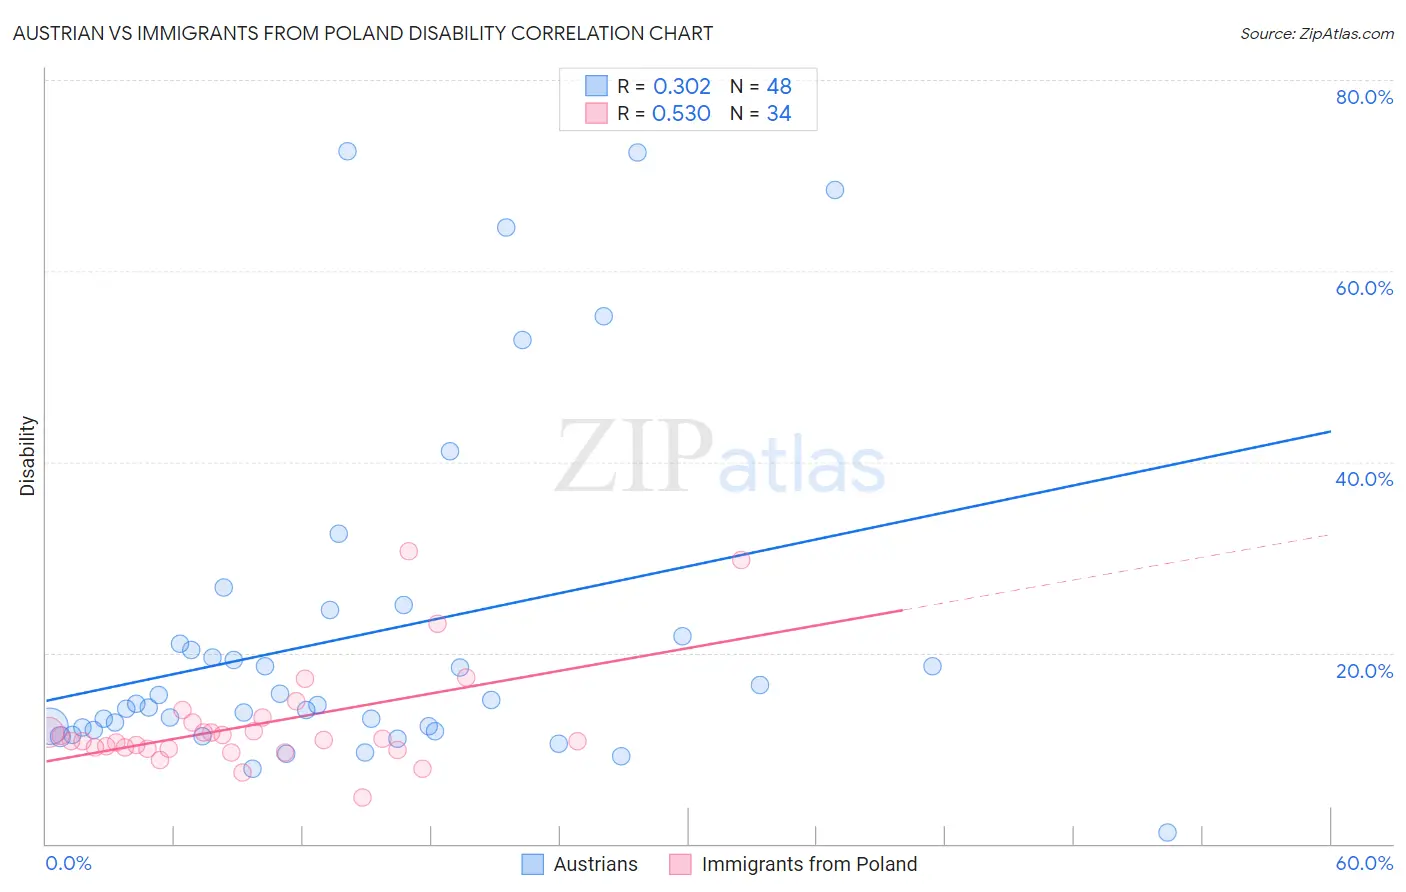
Austrian vs Immigrants from Poland Disability Correlation Chart
The statistical analysis conducted on geographies consisting of 452,057,102 people shows a mild positive correlation between the proportion of Austrians and percentage of population with a disability in the United States with a correlation coefficient (R) of 0.302 and weighted average of 12.0%. Similarly, the statistical analysis conducted on geographies consisting of 304,838,062 people shows a substantial positive correlation between the proportion of Immigrants from Poland and percentage of population with a disability in the United States with a correlation coefficient (R) of 0.530 and weighted average of 11.1%, a difference of 8.5%.
Disability Correlation Summary
| Measurement | Austrian | Immigrants from Poland |
| Minimum | 1.2% | 4.8% |
| Maximum | 72.5% | 30.6% |
| Range | 71.4% | 25.7% |
| Mean | 21.8% | 12.5% |
| Median | 14.6% | 10.9% |
| Interquartile 25% (IQ1) | 12.1% | 10.0% |
| Interquartile 75% (IQ3) | 21.4% | 12.6% |
| Interquartile Range (IQR) | 9.3% | 2.7% |
| Standard Deviation (Sample) | 17.7% | 5.5% |
| Standard Deviation (Population) | 17.5% | 5.4% |
Similar Demographics by Disability
Demographics Similar to Austrians by Disability
In terms of disability, the demographic groups most similar to Austrians are Immigrants from Iraq (12.0%, a difference of 0.010%), Immigrants from Cambodia (12.0%, a difference of 0.030%), Immigrants from Somalia (12.0%, a difference of 0.060%), Czech (12.0%, a difference of 0.11%), and Immigrants from Canada (12.1%, a difference of 0.18%).
| Demographics | Rating | Rank | Disability |
| Immigrants | Western Europe | 10.1 /100 | #205 | Poor 12.0% |
| Immigrants | Senegal | 9.4 /100 | #206 | Tragic 12.0% |
| Immigrants | Thailand | 9.3 /100 | #207 | Tragic 12.0% |
| Immigrants | Caribbean | 9.1 /100 | #208 | Tragic 12.0% |
| Danes | 8.7 /100 | #209 | Tragic 12.0% |
| Czechs | 7.9 /100 | #210 | Tragic 12.0% |
| Immigrants | Cambodia | 7.3 /100 | #211 | Tragic 12.0% |
| Austrians | 7.2 /100 | #212 | Tragic 12.0% |
| Immigrants | Iraq | 7.1 /100 | #213 | Tragic 12.0% |
| Immigrants | Somalia | 6.8 /100 | #214 | Tragic 12.0% |
| Immigrants | Canada | 6.1 /100 | #215 | Tragic 12.1% |
| Panamanians | 5.4 /100 | #216 | Tragic 12.1% |
| Immigrants | North America | 5.3 /100 | #217 | Tragic 12.1% |
| Immigrants | Jamaica | 5.0 /100 | #218 | Tragic 12.1% |
| Croatians | 4.9 /100 | #219 | Tragic 12.1% |
Demographics Similar to Immigrants from Poland by Disability
In terms of disability, the demographic groups most similar to Immigrants from Poland are Chilean (11.1%, a difference of 0.050%), Immigrants from Switzerland (11.1%, a difference of 0.080%), Immigrants from Sierra Leone (11.1%, a difference of 0.090%), Immigrants from Belarus (11.1%, a difference of 0.24%), and Immigrants from Russia (11.1%, a difference of 0.24%).
| Demographics | Rating | Rank | Disability |
| Immigrants | Serbia | 99.4 /100 | #74 | Exceptional 11.0% |
| Immigrants | Vietnam | 99.4 /100 | #75 | Exceptional 11.0% |
| Sierra Leoneans | 99.3 /100 | #76 | Exceptional 11.0% |
| Immigrants | Belgium | 99.3 /100 | #77 | Exceptional 11.0% |
| Immigrants | Cameroon | 99.3 /100 | #78 | Exceptional 11.1% |
| Immigrants | Jordan | 99.3 /100 | #79 | Exceptional 11.1% |
| Immigrants | Ireland | 99.3 /100 | #80 | Exceptional 11.1% |
| Immigrants | Poland | 99.1 /100 | #81 | Exceptional 11.1% |
| Chileans | 99.1 /100 | #82 | Exceptional 11.1% |
| Immigrants | Switzerland | 99.0 /100 | #83 | Exceptional 11.1% |
| Immigrants | Sierra Leone | 99.0 /100 | #84 | Exceptional 11.1% |
| Immigrants | Belarus | 98.9 /100 | #85 | Exceptional 11.1% |
| Immigrants | Russia | 98.9 /100 | #86 | Exceptional 11.1% |
| Palestinians | 98.9 /100 | #87 | Exceptional 11.1% |
| Immigrants | Romania | 98.5 /100 | #88 | Exceptional 11.2% |