Austrian vs Immigrants from Kazakhstan Hearing Disability
COMPARE
Austrian
Immigrants from Kazakhstan
Hearing Disability
Hearing Disability Comparison
Austrians
Immigrants from Kazakhstan
3.4%
HEARING DISABILITY
0.6/ 100
METRIC RATING
248th/ 347
METRIC RANK
2.9%
HEARING DISABILITY
69.6/ 100
METRIC RATING
157th/ 347
METRIC RANK
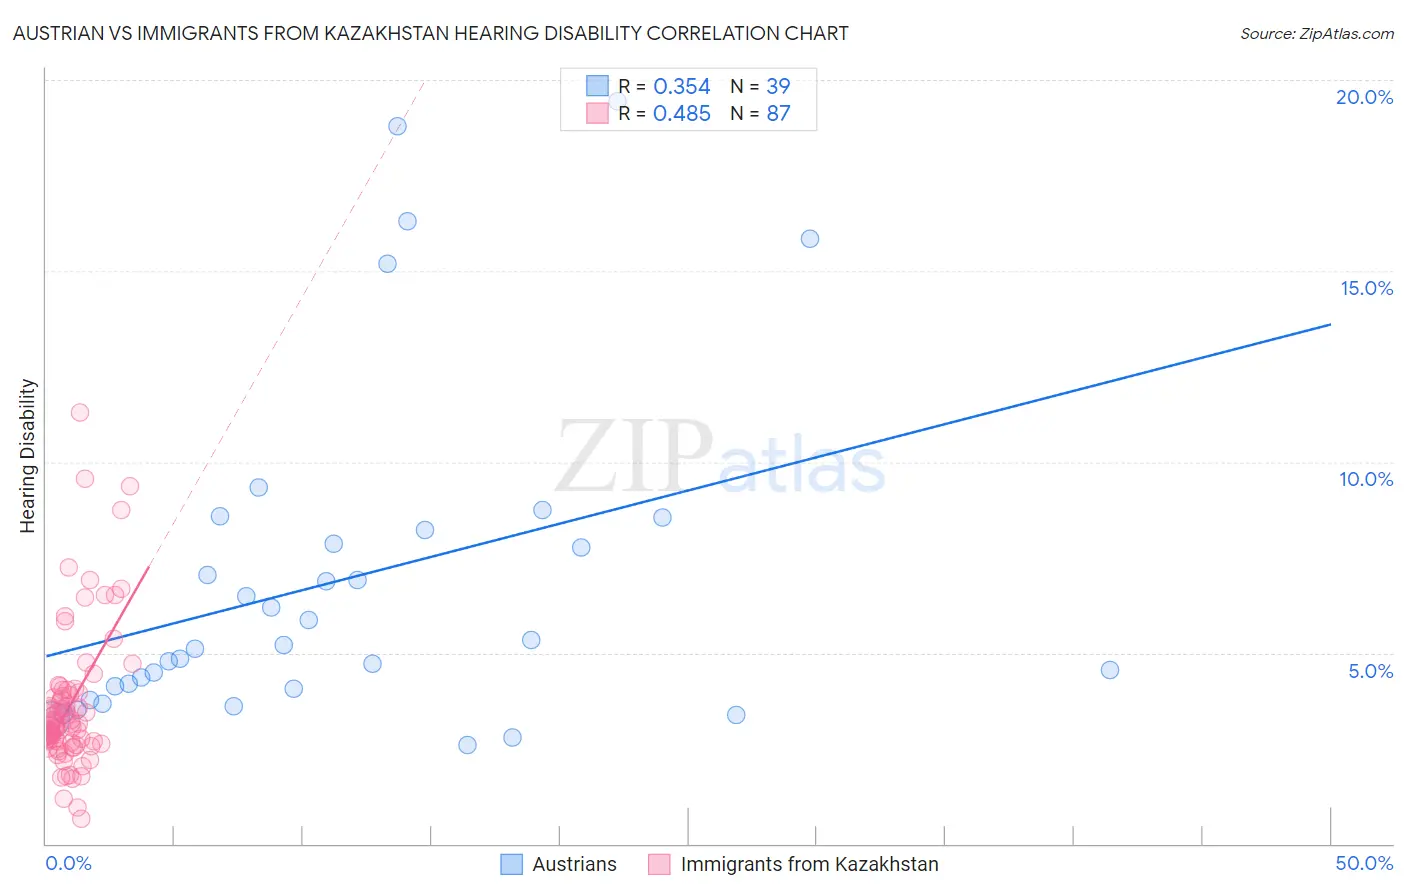
Austrian vs Immigrants from Kazakhstan Hearing Disability Correlation Chart
The statistical analysis conducted on geographies consisting of 451,912,592 people shows a mild positive correlation between the proportion of Austrians and percentage of population with hearing disability in the United States with a correlation coefficient (R) of 0.354 and weighted average of 3.4%. Similarly, the statistical analysis conducted on geographies consisting of 124,435,235 people shows a moderate positive correlation between the proportion of Immigrants from Kazakhstan and percentage of population with hearing disability in the United States with a correlation coefficient (R) of 0.485 and weighted average of 2.9%, a difference of 14.4%.
Hearing Disability Correlation Summary
| Measurement | Austrian | Immigrants from Kazakhstan |
| Minimum | 2.6% | 0.67% |
| Maximum | 19.4% | 11.3% |
| Range | 16.9% | 10.6% |
| Mean | 6.9% | 3.6% |
| Median | 5.2% | 3.1% |
| Interquartile 25% (IQ1) | 4.1% | 2.6% |
| Interquartile 75% (IQ3) | 8.2% | 4.0% |
| Interquartile Range (IQR) | 4.2% | 1.3% |
| Standard Deviation (Sample) | 4.4% | 1.9% |
| Standard Deviation (Population) | 4.3% | 1.9% |
Similar Demographics by Hearing Disability
Demographics Similar to Austrians by Hearing Disability
In terms of hearing disability, the demographic groups most similar to Austrians are Lithuanian (3.4%, a difference of 0.22%), Immigrants from England (3.3%, a difference of 0.42%), Italian (3.4%, a difference of 0.53%), Yuman (3.4%, a difference of 0.54%), and Immigrants from Scotland (3.3%, a difference of 0.71%).
| Demographics | Rating | Rank | Hearing Disability |
| Samoans | 1.1 /100 | #241 | Tragic 3.3% |
| Yugoslavians | 1.0 /100 | #242 | Tragic 3.3% |
| Immigrants | Western Europe | 1.0 /100 | #243 | Tragic 3.3% |
| Assyrians/Chaldeans/Syriacs | 0.9 /100 | #244 | Tragic 3.3% |
| Immigrants | Scotland | 0.8 /100 | #245 | Tragic 3.3% |
| Immigrants | England | 0.7 /100 | #246 | Tragic 3.3% |
| Lithuanians | 0.6 /100 | #247 | Tragic 3.4% |
| Austrians | 0.6 /100 | #248 | Tragic 3.4% |
| Italians | 0.4 /100 | #249 | Tragic 3.4% |
| Yuman | 0.4 /100 | #250 | Tragic 3.4% |
| Hungarians | 0.4 /100 | #251 | Tragic 3.4% |
| Croatians | 0.4 /100 | #252 | Tragic 3.4% |
| Carpatho Rusyns | 0.3 /100 | #253 | Tragic 3.4% |
| Slavs | 0.2 /100 | #254 | Tragic 3.4% |
| Poles | 0.2 /100 | #255 | Tragic 3.4% |
Demographics Similar to Immigrants from Kazakhstan by Hearing Disability
In terms of hearing disability, the demographic groups most similar to Immigrants from Kazakhstan are Immigrants from Burma/Myanmar (2.9%, a difference of 0.010%), Immigrants from Poland (2.9%, a difference of 0.070%), Costa Rican (2.9%, a difference of 0.21%), Immigrants from Lebanon (2.9%, a difference of 0.22%), and Immigrants from Australia (2.9%, a difference of 0.25%).
| Demographics | Rating | Rank | Hearing Disability |
| Palestinians | 73.6 /100 | #150 | Good 2.9% |
| Immigrants | France | 73.1 /100 | #151 | Good 2.9% |
| Immigrants | Lithuania | 73.0 /100 | #152 | Good 2.9% |
| Sudanese | 72.1 /100 | #153 | Good 2.9% |
| Immigrants | Lebanon | 71.5 /100 | #154 | Good 2.9% |
| Costa Ricans | 71.4 /100 | #155 | Good 2.9% |
| Immigrants | Poland | 70.2 /100 | #156 | Good 2.9% |
| Immigrants | Kazakhstan | 69.6 /100 | #157 | Good 2.9% |
| Immigrants | Burma/Myanmar | 69.5 /100 | #158 | Good 2.9% |
| Immigrants | Australia | 67.4 /100 | #159 | Good 2.9% |
| Immigrants | Fiji | 67.1 /100 | #160 | Good 2.9% |
| Albanians | 66.6 /100 | #161 | Good 2.9% |
| Immigrants | Japan | 66.3 /100 | #162 | Good 2.9% |
| Immigrants | Central America | 64.9 /100 | #163 | Good 3.0% |
| Immigrants | Cambodia | 64.8 /100 | #164 | Good 3.0% |