Austrian vs Alsatian 9th Grade
COMPARE
Austrian
Alsatian
9th Grade
9th Grade Comparison
Austrians
Alsatians
96.0%
9TH GRADE
99.8/ 100
METRIC RATING
53rd/ 347
METRIC RANK
94.9%
9TH GRADE
58.6/ 100
METRIC RATING
170th/ 347
METRIC RANK
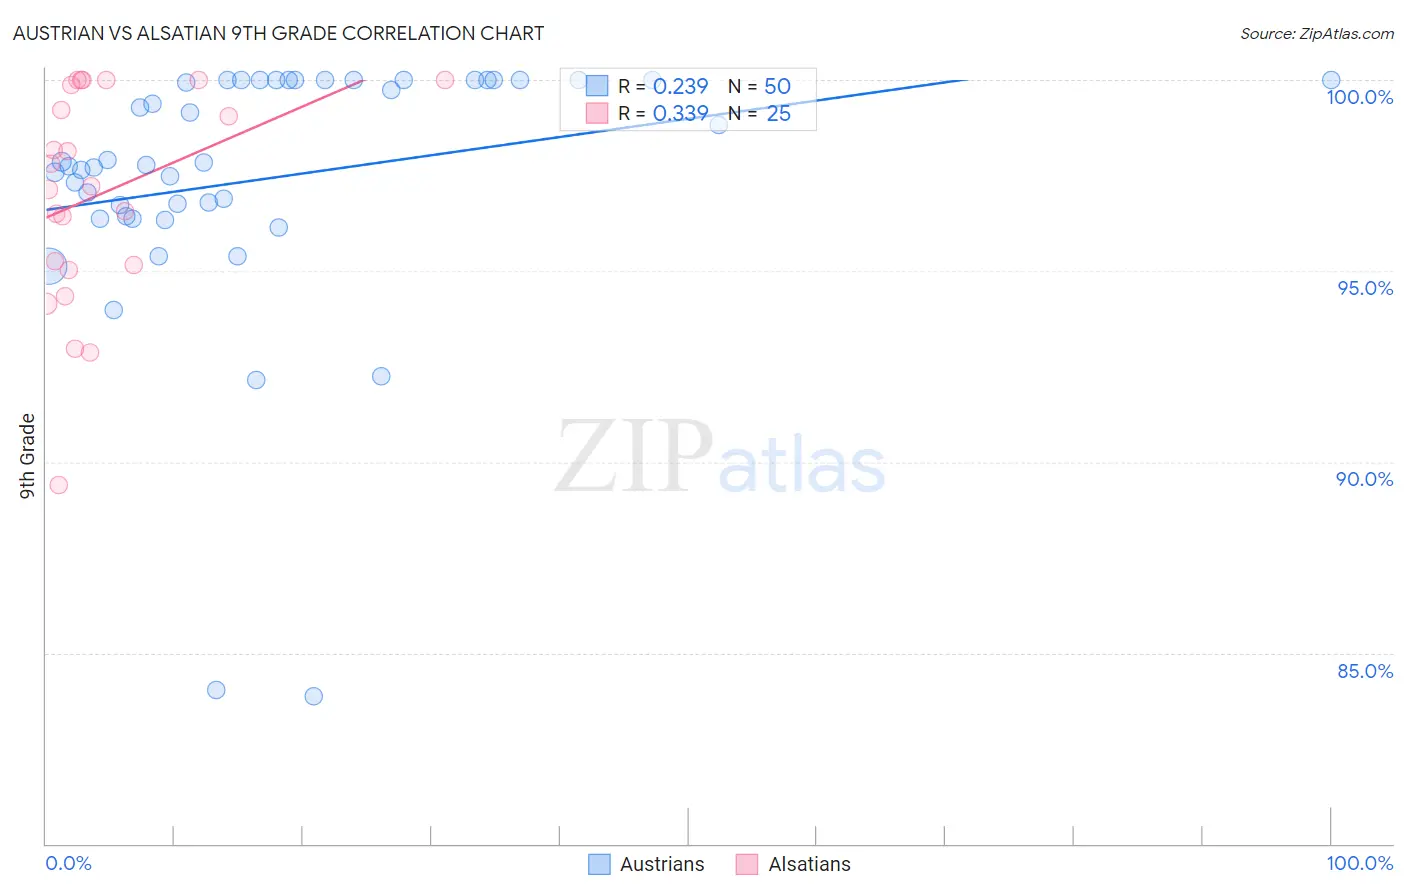
Austrian vs Alsatian 9th Grade Correlation Chart
The statistical analysis conducted on geographies consisting of 452,082,820 people shows a weak positive correlation between the proportion of Austrians and percentage of population with at least 9th grade education in the United States with a correlation coefficient (R) of 0.239 and weighted average of 96.0%. Similarly, the statistical analysis conducted on geographies consisting of 82,682,365 people shows a mild positive correlation between the proportion of Alsatians and percentage of population with at least 9th grade education in the United States with a correlation coefficient (R) of 0.339 and weighted average of 94.9%, a difference of 1.1%.
9th Grade Correlation Summary
| Measurement | Austrian | Alsatian |
| Minimum | 83.9% | 89.4% |
| Maximum | 100.0% | 100.0% |
| Range | 16.1% | 10.6% |
| Mean | 97.4% | 97.0% |
| Median | 97.8% | 97.2% |
| Interquartile 25% (IQ1) | 96.4% | 95.1% |
| Interquartile 75% (IQ3) | 100.0% | 99.9% |
| Interquartile Range (IQR) | 3.6% | 4.8% |
| Standard Deviation (Sample) | 3.4% | 2.8% |
| Standard Deviation (Population) | 3.4% | 2.8% |
Similar Demographics by 9th Grade
Demographics Similar to Austrians by 9th Grade
In terms of 9th grade, the demographic groups most similar to Austrians are Serbian (96.0%, a difference of 0.010%), Immigrants from Canada (96.0%, a difference of 0.010%), Immigrants from Northern Europe (96.0%, a difference of 0.020%), Immigrants from Austria (96.0%, a difference of 0.020%), and Celtic (96.0%, a difference of 0.030%).
| Demographics | Rating | Rank | 9th Grade |
| Immigrants | India | 99.9 /100 | #46 | Exceptional 96.1% |
| Russians | 99.9 /100 | #47 | Exceptional 96.0% |
| Australians | 99.9 /100 | #48 | Exceptional 96.0% |
| Greeks | 99.9 /100 | #49 | Exceptional 96.0% |
| Celtics | 99.9 /100 | #50 | Exceptional 96.0% |
| Immigrants | Northern Europe | 99.9 /100 | #51 | Exceptional 96.0% |
| Serbians | 99.9 /100 | #52 | Exceptional 96.0% |
| Austrians | 99.8 /100 | #53 | Exceptional 96.0% |
| Immigrants | Canada | 99.8 /100 | #54 | Exceptional 96.0% |
| Immigrants | Austria | 99.8 /100 | #55 | Exceptional 96.0% |
| Immigrants | North America | 99.8 /100 | #56 | Exceptional 96.0% |
| Macedonians | 99.8 /100 | #57 | Exceptional 96.0% |
| Aleuts | 99.8 /100 | #58 | Exceptional 96.0% |
| New Zealanders | 99.8 /100 | #59 | Exceptional 95.9% |
| Native Hawaiians | 99.8 /100 | #60 | Exceptional 95.9% |
Demographics Similar to Alsatians by 9th Grade
In terms of 9th grade, the demographic groups most similar to Alsatians are Colville (94.9%, a difference of 0.0%), Spaniard (94.9%, a difference of 0.010%), Immigrants from Brazil (95.0%, a difference of 0.020%), Chilean (95.0%, a difference of 0.020%), and Blackfeet (95.0%, a difference of 0.030%).
| Demographics | Rating | Rank | 9th Grade |
| Pakistanis | 64.1 /100 | #163 | Good 95.0% |
| Venezuelans | 63.6 /100 | #164 | Good 95.0% |
| Blackfeet | 62.6 /100 | #165 | Good 95.0% |
| Ute | 62.6 /100 | #166 | Good 95.0% |
| Immigrants | Brazil | 61.1 /100 | #167 | Good 95.0% |
| Chileans | 60.7 /100 | #168 | Good 95.0% |
| Spaniards | 59.6 /100 | #169 | Average 94.9% |
| Alsatians | 58.6 /100 | #170 | Average 94.9% |
| Colville | 58.5 /100 | #171 | Average 94.9% |
| Iraqis | 54.0 /100 | #172 | Average 94.9% |
| Cheyenne | 51.5 /100 | #173 | Average 94.9% |
| Immigrants | Egypt | 50.0 /100 | #174 | Average 94.9% |
| Brazilians | 49.8 /100 | #175 | Average 94.9% |
| Immigrants | Spain | 49.1 /100 | #176 | Average 94.9% |
| Immigrants | Iraq | 47.8 /100 | #177 | Average 94.9% |