Australian vs Immigrants from Ukraine Hearing Disability
COMPARE
Australian
Immigrants from Ukraine
Hearing Disability
Hearing Disability Comparison
Australians
Immigrants from Ukraine
3.2%
HEARING DISABILITY
8.1/ 100
METRIC RATING
214th/ 347
METRIC RANK
3.0%
HEARING DISABILITY
56.6/ 100
METRIC RATING
171st/ 347
METRIC RANK
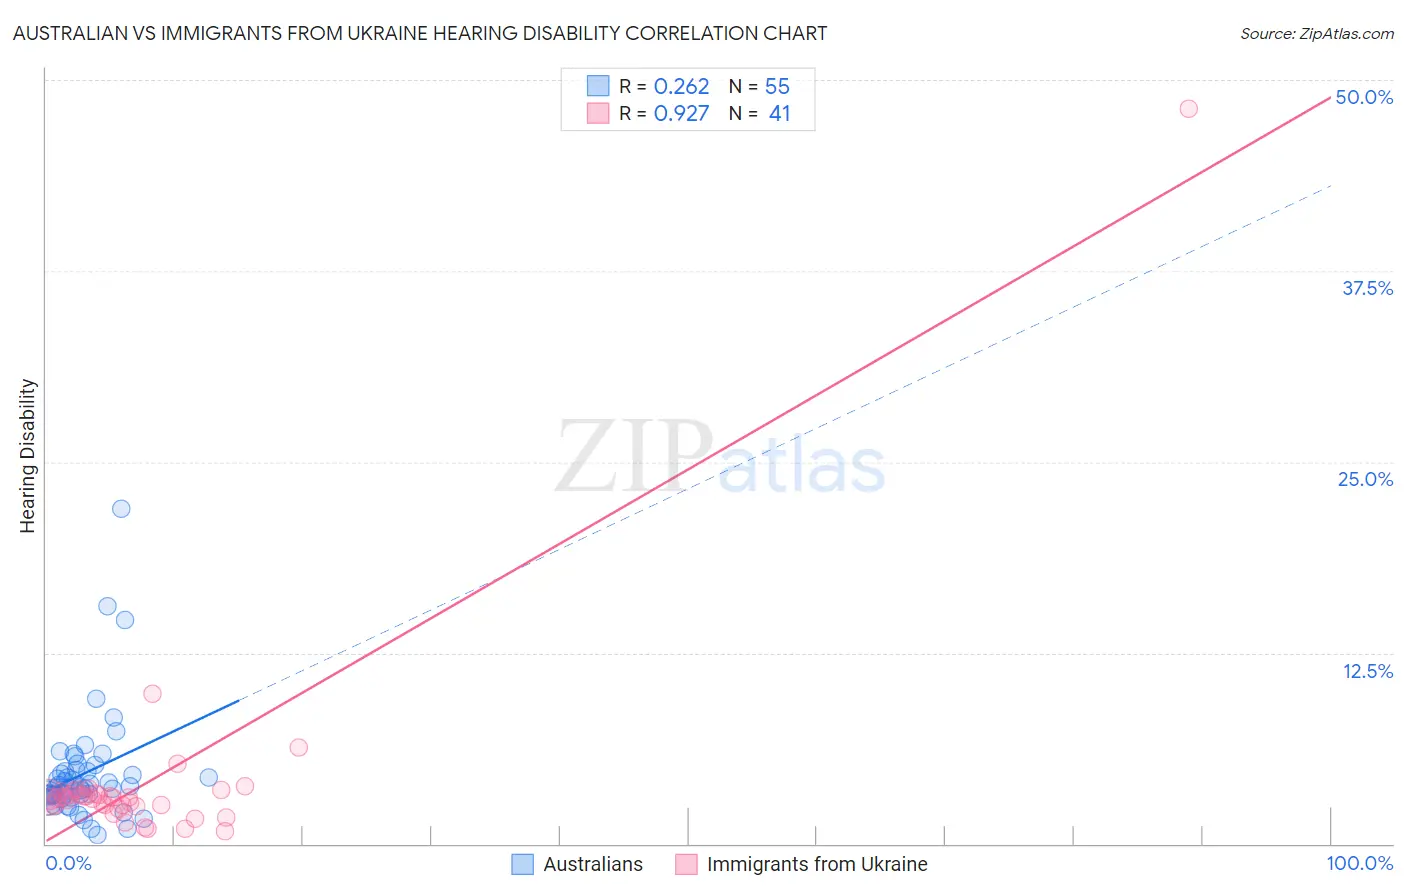
Australian vs Immigrants from Ukraine Hearing Disability Correlation Chart
The statistical analysis conducted on geographies consisting of 224,103,986 people shows a weak positive correlation between the proportion of Australians and percentage of population with hearing disability in the United States with a correlation coefficient (R) of 0.262 and weighted average of 3.2%. Similarly, the statistical analysis conducted on geographies consisting of 289,631,097 people shows a near-perfect positive correlation between the proportion of Immigrants from Ukraine and percentage of population with hearing disability in the United States with a correlation coefficient (R) of 0.927 and weighted average of 3.0%, a difference of 6.4%.
Hearing Disability Correlation Summary
| Measurement | Australian | Immigrants from Ukraine |
| Minimum | 0.57% | 0.79% |
| Maximum | 21.9% | 48.1% |
| Range | 21.4% | 47.4% |
| Mean | 4.6% | 4.1% |
| Median | 3.7% | 3.0% |
| Interquartile 25% (IQ1) | 3.1% | 2.5% |
| Interquartile 75% (IQ3) | 4.8% | 3.3% |
| Interquartile Range (IQR) | 1.7% | 0.84% |
| Standard Deviation (Sample) | 3.6% | 7.2% |
| Standard Deviation (Population) | 3.6% | 7.1% |
Similar Demographics by Hearing Disability
Demographics Similar to Australians by Hearing Disability
In terms of hearing disability, the demographic groups most similar to Australians are Bangladeshi (3.2%, a difference of 0.010%), Immigrants from Norway (3.2%, a difference of 0.25%), Russian (3.2%, a difference of 0.33%), Immigrants from Northern Europe (3.2%, a difference of 0.37%), and New Zealander (3.2%, a difference of 0.43%).
| Demographics | Rating | Rank | Hearing Disability |
| Hispanics or Latinos | 15.1 /100 | #207 | Poor 3.1% |
| Immigrants | Latvia | 12.7 /100 | #208 | Poor 3.1% |
| Immigrants | Hungary | 12.5 /100 | #209 | Poor 3.1% |
| Cape Verdeans | 12.2 /100 | #210 | Poor 3.1% |
| Romanians | 12.1 /100 | #211 | Poor 3.1% |
| Pakistanis | 11.1 /100 | #212 | Poor 3.1% |
| Immigrants | Iraq | 10.5 /100 | #213 | Poor 3.1% |
| Australians | 8.1 /100 | #214 | Tragic 3.2% |
| Bangladeshis | 8.1 /100 | #215 | Tragic 3.2% |
| Immigrants | Norway | 7.3 /100 | #216 | Tragic 3.2% |
| Russians | 7.1 /100 | #217 | Tragic 3.2% |
| Immigrants | Northern Europe | 7.0 /100 | #218 | Tragic 3.2% |
| New Zealanders | 6.8 /100 | #219 | Tragic 3.2% |
| Malaysians | 6.6 /100 | #220 | Tragic 3.2% |
| Immigrants | Laos | 6.6 /100 | #221 | Tragic 3.2% |
Demographics Similar to Immigrants from Ukraine by Hearing Disability
In terms of hearing disability, the demographic groups most similar to Immigrants from Ukraine are Immigrants from Cabo Verde (3.0%, a difference of 0.030%), Armenian (3.0%, a difference of 0.060%), Arab (3.0%, a difference of 0.10%), Immigrants from Greece (3.0%, a difference of 0.12%), and Immigrants from Eastern Europe (3.0%, a difference of 0.14%).
| Demographics | Rating | Rank | Hearing Disability |
| Immigrants | Cambodia | 64.8 /100 | #164 | Good 3.0% |
| Immigrants | Zimbabwe | 64.2 /100 | #165 | Good 3.0% |
| Immigrants | South Eastern Asia | 62.9 /100 | #166 | Good 3.0% |
| Immigrants | Eastern Europe | 58.1 /100 | #167 | Average 3.0% |
| Immigrants | Greece | 57.9 /100 | #168 | Average 3.0% |
| Arabs | 57.6 /100 | #169 | Average 3.0% |
| Immigrants | Cabo Verde | 56.9 /100 | #170 | Average 3.0% |
| Immigrants | Ukraine | 56.6 /100 | #171 | Average 3.0% |
| Armenians | 56.0 /100 | #172 | Average 3.0% |
| Immigrants | Serbia | 51.1 /100 | #173 | Average 3.0% |
| Indonesians | 50.0 /100 | #174 | Average 3.0% |
| Immigrants | Romania | 48.4 /100 | #175 | Average 3.0% |
| Panamanians | 47.0 /100 | #176 | Average 3.0% |
| Immigrants | Philippines | 46.4 /100 | #177 | Average 3.0% |
| Japanese | 46.0 /100 | #178 | Average 3.0% |