Australian vs Immigrants from Barbados Hearing Disability
COMPARE
Australian
Immigrants from Barbados
Hearing Disability
Hearing Disability Comparison
Australians
Immigrants from Barbados
3.2%
HEARING DISABILITY
8.1/ 100
METRIC RATING
214th/ 347
METRIC RANK
2.4%
HEARING DISABILITY
100.0/ 100
METRIC RATING
5th/ 347
METRIC RANK
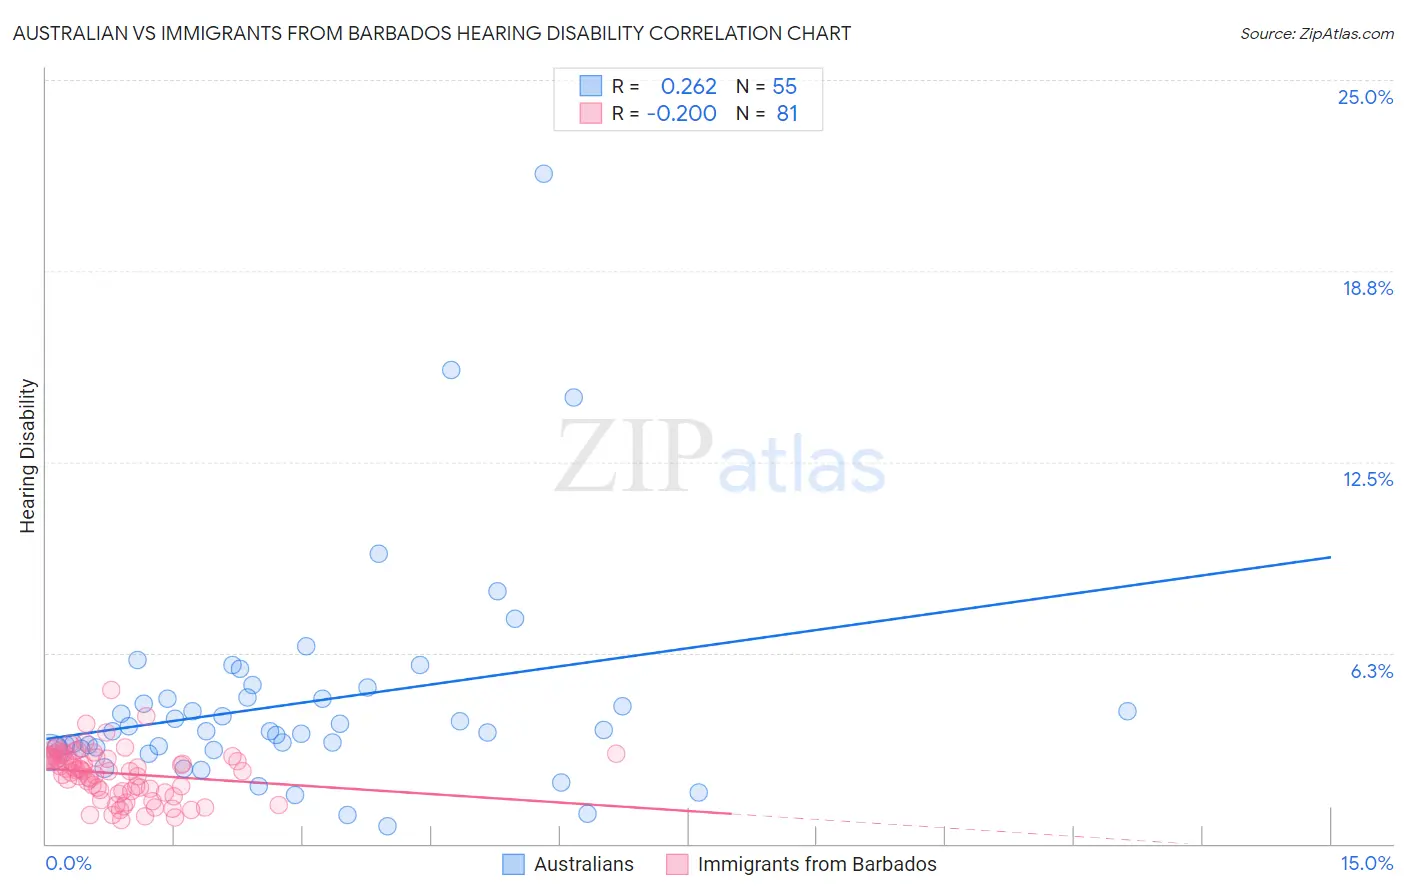
Australian vs Immigrants from Barbados Hearing Disability Correlation Chart
The statistical analysis conducted on geographies consisting of 224,103,986 people shows a weak positive correlation between the proportion of Australians and percentage of population with hearing disability in the United States with a correlation coefficient (R) of 0.262 and weighted average of 3.2%. Similarly, the statistical analysis conducted on geographies consisting of 112,766,175 people shows a poor negative correlation between the proportion of Immigrants from Barbados and percentage of population with hearing disability in the United States with a correlation coefficient (R) of -0.200 and weighted average of 2.4%, a difference of 34.0%.
Hearing Disability Correlation Summary
| Measurement | Australian | Immigrants from Barbados |
| Minimum | 0.57% | 0.76% |
| Maximum | 21.9% | 5.0% |
| Range | 21.4% | 4.3% |
| Mean | 4.6% | 2.3% |
| Median | 3.7% | 2.4% |
| Interquartile 25% (IQ1) | 3.1% | 1.7% |
| Interquartile 75% (IQ3) | 4.8% | 2.9% |
| Interquartile Range (IQR) | 1.7% | 1.1% |
| Standard Deviation (Sample) | 3.6% | 0.82% |
| Standard Deviation (Population) | 3.6% | 0.81% |
Similar Demographics by Hearing Disability
Demographics Similar to Australians by Hearing Disability
In terms of hearing disability, the demographic groups most similar to Australians are Bangladeshi (3.2%, a difference of 0.010%), Immigrants from Norway (3.2%, a difference of 0.25%), Russian (3.2%, a difference of 0.33%), Immigrants from Northern Europe (3.2%, a difference of 0.37%), and New Zealander (3.2%, a difference of 0.43%).
| Demographics | Rating | Rank | Hearing Disability |
| Hispanics or Latinos | 15.1 /100 | #207 | Poor 3.1% |
| Immigrants | Latvia | 12.7 /100 | #208 | Poor 3.1% |
| Immigrants | Hungary | 12.5 /100 | #209 | Poor 3.1% |
| Cape Verdeans | 12.2 /100 | #210 | Poor 3.1% |
| Romanians | 12.1 /100 | #211 | Poor 3.1% |
| Pakistanis | 11.1 /100 | #212 | Poor 3.1% |
| Immigrants | Iraq | 10.5 /100 | #213 | Poor 3.1% |
| Australians | 8.1 /100 | #214 | Tragic 3.2% |
| Bangladeshis | 8.1 /100 | #215 | Tragic 3.2% |
| Immigrants | Norway | 7.3 /100 | #216 | Tragic 3.2% |
| Russians | 7.1 /100 | #217 | Tragic 3.2% |
| Immigrants | Northern Europe | 7.0 /100 | #218 | Tragic 3.2% |
| New Zealanders | 6.8 /100 | #219 | Tragic 3.2% |
| Malaysians | 6.6 /100 | #220 | Tragic 3.2% |
| Immigrants | Laos | 6.6 /100 | #221 | Tragic 3.2% |
Demographics Similar to Immigrants from Barbados by Hearing Disability
In terms of hearing disability, the demographic groups most similar to Immigrants from Barbados are Vietnamese (2.4%, a difference of 1.1%), Immigrants from Guyana (2.3%, a difference of 1.9%), Immigrants from Bangladesh (2.4%, a difference of 2.7%), British West Indian (2.4%, a difference of 2.9%), and Guyanese (2.3%, a difference of 3.3%).
| Demographics | Rating | Rank | Hearing Disability |
| Immigrants | Grenada | 100.0 /100 | #1 | Exceptional 2.2% |
| Immigrants | St. Vincent and the Grenadines | 100.0 /100 | #2 | Exceptional 2.3% |
| Guyanese | 100.0 /100 | #3 | Exceptional 2.3% |
| Immigrants | Guyana | 100.0 /100 | #4 | Exceptional 2.3% |
| Immigrants | Barbados | 100.0 /100 | #5 | Exceptional 2.4% |
| Vietnamese | 100.0 /100 | #6 | Exceptional 2.4% |
| Immigrants | Bangladesh | 100.0 /100 | #7 | Exceptional 2.4% |
| British West Indians | 100.0 /100 | #8 | Exceptional 2.4% |
| Immigrants | Dominican Republic | 100.0 /100 | #9 | Exceptional 2.4% |
| Immigrants | Ecuador | 99.9 /100 | #10 | Exceptional 2.5% |
| Immigrants | Trinidad and Tobago | 99.9 /100 | #11 | Exceptional 2.5% |
| Trinidadians and Tobagonians | 99.9 /100 | #12 | Exceptional 2.5% |
| Sierra Leoneans | 99.9 /100 | #13 | Exceptional 2.5% |
| Ecuadorians | 99.9 /100 | #14 | Exceptional 2.5% |
| Barbadians | 99.9 /100 | #15 | Exceptional 2.5% |