Australian vs Nepalese Hearing Disability
COMPARE
Australian
Nepalese
Hearing Disability
Hearing Disability Comparison
Australians
Nepalese
3.2%
HEARING DISABILITY
8.1/ 100
METRIC RATING
214th/ 347
METRIC RANK
3.3%
HEARING DISABILITY
1.2/ 100
METRIC RATING
239th/ 347
METRIC RANK
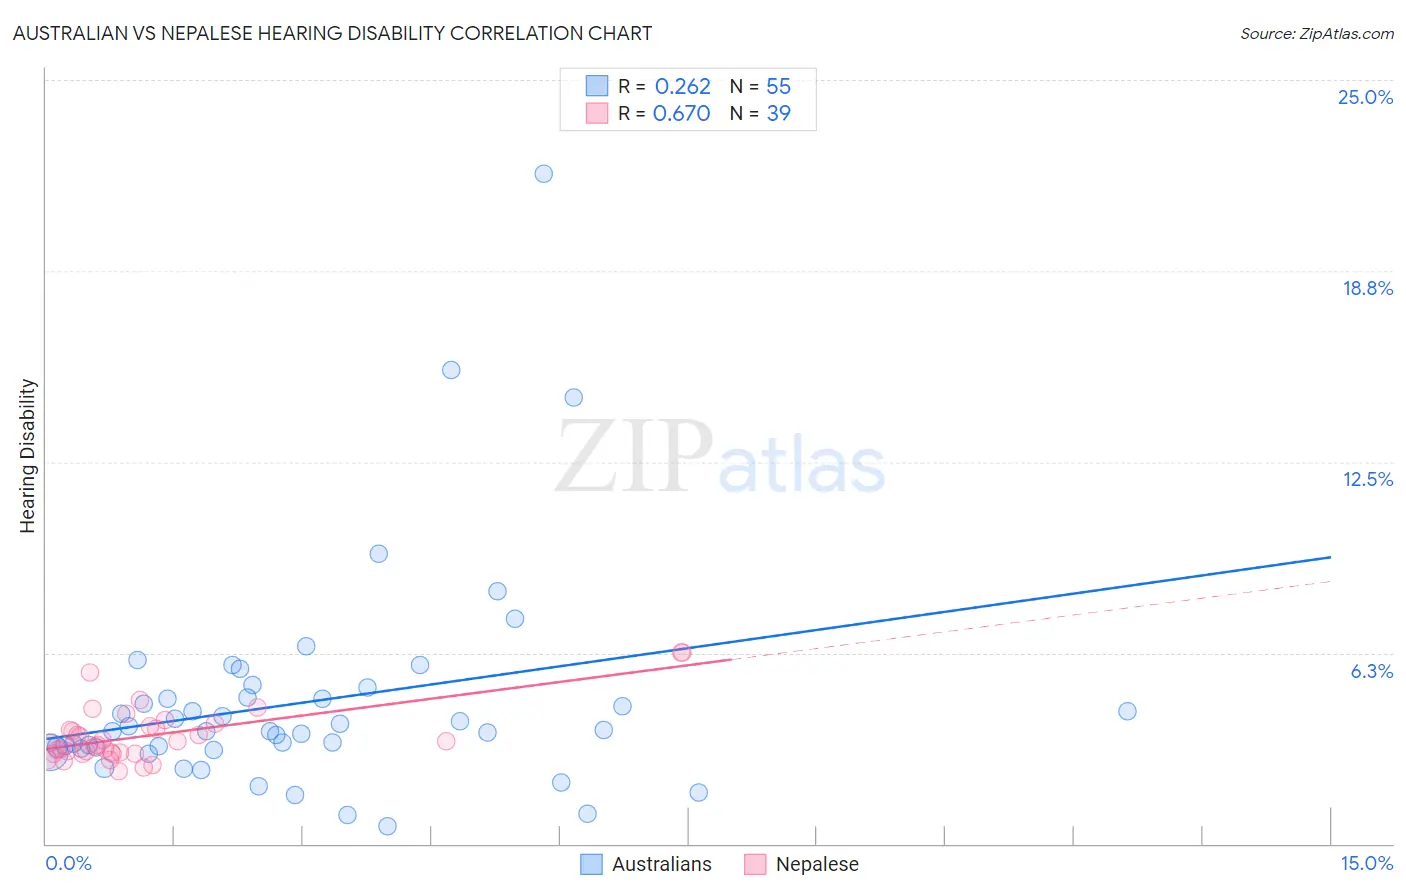
Australian vs Nepalese Hearing Disability Correlation Chart
The statistical analysis conducted on geographies consisting of 224,103,986 people shows a weak positive correlation between the proportion of Australians and percentage of population with hearing disability in the United States with a correlation coefficient (R) of 0.262 and weighted average of 3.2%. Similarly, the statistical analysis conducted on geographies consisting of 24,517,800 people shows a significant positive correlation between the proportion of Nepalese and percentage of population with hearing disability in the United States with a correlation coefficient (R) of 0.670 and weighted average of 3.3%, a difference of 4.4%.
Hearing Disability Correlation Summary
| Measurement | Australian | Nepalese |
| Minimum | 0.57% | 2.4% |
| Maximum | 21.9% | 6.3% |
| Range | 21.4% | 3.9% |
| Mean | 4.6% | 3.5% |
| Median | 3.7% | 3.3% |
| Interquartile 25% (IQ1) | 3.1% | 3.0% |
| Interquartile 75% (IQ3) | 4.8% | 3.9% |
| Interquartile Range (IQR) | 1.7% | 0.90% |
| Standard Deviation (Sample) | 3.6% | 0.92% |
| Standard Deviation (Population) | 3.6% | 0.91% |
Similar Demographics by Hearing Disability
Demographics Similar to Australians by Hearing Disability
In terms of hearing disability, the demographic groups most similar to Australians are Bangladeshi (3.2%, a difference of 0.010%), Immigrants from Norway (3.2%, a difference of 0.25%), Russian (3.2%, a difference of 0.33%), Immigrants from Northern Europe (3.2%, a difference of 0.37%), and New Zealander (3.2%, a difference of 0.43%).
| Demographics | Rating | Rank | Hearing Disability |
| Hispanics or Latinos | 15.1 /100 | #207 | Poor 3.1% |
| Immigrants | Latvia | 12.7 /100 | #208 | Poor 3.1% |
| Immigrants | Hungary | 12.5 /100 | #209 | Poor 3.1% |
| Cape Verdeans | 12.2 /100 | #210 | Poor 3.1% |
| Romanians | 12.1 /100 | #211 | Poor 3.1% |
| Pakistanis | 11.1 /100 | #212 | Poor 3.1% |
| Immigrants | Iraq | 10.5 /100 | #213 | Poor 3.1% |
| Australians | 8.1 /100 | #214 | Tragic 3.2% |
| Bangladeshis | 8.1 /100 | #215 | Tragic 3.2% |
| Immigrants | Norway | 7.3 /100 | #216 | Tragic 3.2% |
| Russians | 7.1 /100 | #217 | Tragic 3.2% |
| Immigrants | Northern Europe | 7.0 /100 | #218 | Tragic 3.2% |
| New Zealanders | 6.8 /100 | #219 | Tragic 3.2% |
| Malaysians | 6.6 /100 | #220 | Tragic 3.2% |
| Immigrants | Laos | 6.6 /100 | #221 | Tragic 3.2% |
Demographics Similar to Nepalese by Hearing Disability
In terms of hearing disability, the demographic groups most similar to Nepalese are Immigrants from Netherlands (3.3%, a difference of 0.18%), Samoan (3.3%, a difference of 0.25%), Yugoslavian (3.3%, a difference of 0.36%), Immigrants from Western Europe (3.3%, a difference of 0.53%), and Assyrian/Chaldean/Syriac (3.3%, a difference of 0.60%).
| Demographics | Rating | Rank | Hearing Disability |
| Ukrainians | 2.9 /100 | #232 | Tragic 3.2% |
| Estonians | 2.4 /100 | #233 | Tragic 3.3% |
| Central American Indians | 2.3 /100 | #234 | Tragic 3.3% |
| Guamanians/Chamorros | 2.2 /100 | #235 | Tragic 3.3% |
| Serbians | 2.2 /100 | #236 | Tragic 3.3% |
| Immigrants | Austria | 1.8 /100 | #237 | Tragic 3.3% |
| German Russians | 1.8 /100 | #238 | Tragic 3.3% |
| Nepalese | 1.2 /100 | #239 | Tragic 3.3% |
| Immigrants | Netherlands | 1.1 /100 | #240 | Tragic 3.3% |
| Samoans | 1.1 /100 | #241 | Tragic 3.3% |
| Yugoslavians | 1.0 /100 | #242 | Tragic 3.3% |
| Immigrants | Western Europe | 1.0 /100 | #243 | Tragic 3.3% |
| Assyrians/Chaldeans/Syriacs | 0.9 /100 | #244 | Tragic 3.3% |
| Immigrants | Scotland | 0.8 /100 | #245 | Tragic 3.3% |
| Immigrants | England | 0.7 /100 | #246 | Tragic 3.3% |