Australian vs Immigrants from Somalia Hearing Disability
COMPARE
Australian
Immigrants from Somalia
Hearing Disability
Hearing Disability Comparison
Australians
Immigrants from Somalia
3.2%
HEARING DISABILITY
8.1/ 100
METRIC RATING
214th/ 347
METRIC RANK
2.8%
HEARING DISABILITY
95.5/ 100
METRIC RATING
96th/ 347
METRIC RANK
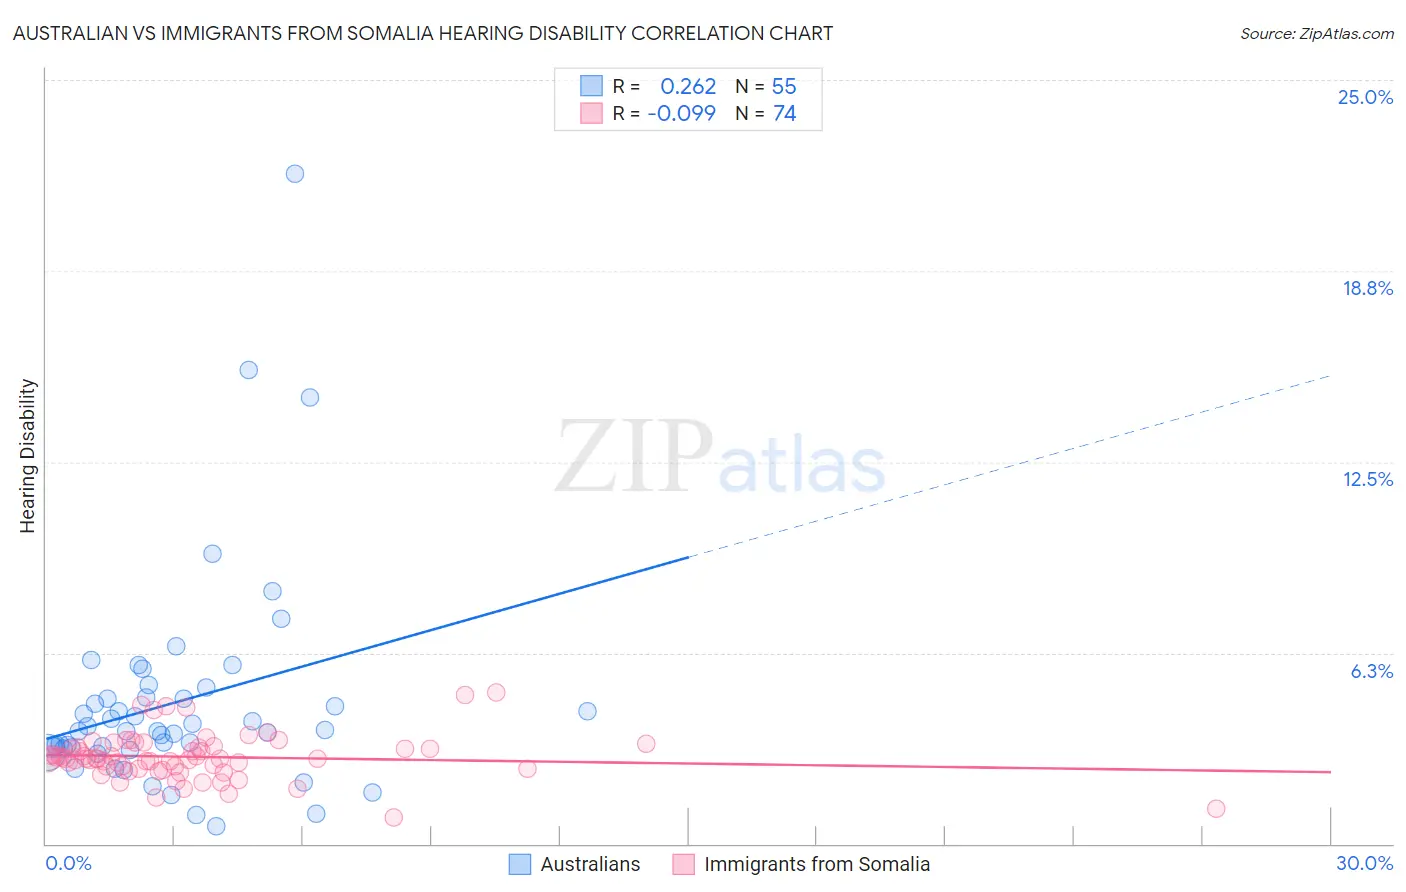
Australian vs Immigrants from Somalia Hearing Disability Correlation Chart
The statistical analysis conducted on geographies consisting of 224,103,986 people shows a weak positive correlation between the proportion of Australians and percentage of population with hearing disability in the United States with a correlation coefficient (R) of 0.262 and weighted average of 3.2%. Similarly, the statistical analysis conducted on geographies consisting of 92,097,804 people shows a slight negative correlation between the proportion of Immigrants from Somalia and percentage of population with hearing disability in the United States with a correlation coefficient (R) of -0.099 and weighted average of 2.8%, a difference of 13.9%.
Hearing Disability Correlation Summary
| Measurement | Australian | Immigrants from Somalia |
| Minimum | 0.57% | 0.87% |
| Maximum | 21.9% | 5.0% |
| Range | 21.4% | 4.1% |
| Mean | 4.6% | 2.8% |
| Median | 3.7% | 2.8% |
| Interquartile 25% (IQ1) | 3.1% | 2.5% |
| Interquartile 75% (IQ3) | 4.8% | 3.2% |
| Interquartile Range (IQR) | 1.7% | 0.69% |
| Standard Deviation (Sample) | 3.6% | 0.75% |
| Standard Deviation (Population) | 3.6% | 0.75% |
Similar Demographics by Hearing Disability
Demographics Similar to Australians by Hearing Disability
In terms of hearing disability, the demographic groups most similar to Australians are Bangladeshi (3.2%, a difference of 0.010%), Immigrants from Norway (3.2%, a difference of 0.25%), Russian (3.2%, a difference of 0.33%), Immigrants from Northern Europe (3.2%, a difference of 0.37%), and New Zealander (3.2%, a difference of 0.43%).
| Demographics | Rating | Rank | Hearing Disability |
| Hispanics or Latinos | 15.1 /100 | #207 | Poor 3.1% |
| Immigrants | Latvia | 12.7 /100 | #208 | Poor 3.1% |
| Immigrants | Hungary | 12.5 /100 | #209 | Poor 3.1% |
| Cape Verdeans | 12.2 /100 | #210 | Poor 3.1% |
| Romanians | 12.1 /100 | #211 | Poor 3.1% |
| Pakistanis | 11.1 /100 | #212 | Poor 3.1% |
| Immigrants | Iraq | 10.5 /100 | #213 | Poor 3.1% |
| Australians | 8.1 /100 | #214 | Tragic 3.2% |
| Bangladeshis | 8.1 /100 | #215 | Tragic 3.2% |
| Immigrants | Norway | 7.3 /100 | #216 | Tragic 3.2% |
| Russians | 7.1 /100 | #217 | Tragic 3.2% |
| Immigrants | Northern Europe | 7.0 /100 | #218 | Tragic 3.2% |
| New Zealanders | 6.8 /100 | #219 | Tragic 3.2% |
| Malaysians | 6.6 /100 | #220 | Tragic 3.2% |
| Immigrants | Laos | 6.6 /100 | #221 | Tragic 3.2% |
Demographics Similar to Immigrants from Somalia by Hearing Disability
In terms of hearing disability, the demographic groups most similar to Immigrants from Somalia are Immigrants from Afghanistan (2.8%, a difference of 0.17%), Israeli (2.8%, a difference of 0.19%), Uruguayan (2.8%, a difference of 0.21%), Immigrants from Honduras (2.8%, a difference of 0.23%), and Immigrants from Guatemala (2.8%, a difference of 0.27%).
| Demographics | Rating | Rank | Hearing Disability |
| Belizeans | 96.6 /100 | #89 | Exceptional 2.8% |
| Immigrants | Morocco | 96.6 /100 | #90 | Exceptional 2.8% |
| Immigrants | Middle Africa | 96.5 /100 | #91 | Exceptional 2.8% |
| Iranians | 96.4 /100 | #92 | Exceptional 2.8% |
| Immigrants | Kuwait | 96.3 /100 | #93 | Exceptional 2.8% |
| Uruguayans | 95.9 /100 | #94 | Exceptional 2.8% |
| Israelis | 95.9 /100 | #95 | Exceptional 2.8% |
| Immigrants | Somalia | 95.5 /100 | #96 | Exceptional 2.8% |
| Immigrants | Afghanistan | 95.3 /100 | #97 | Exceptional 2.8% |
| Immigrants | Honduras | 95.1 /100 | #98 | Exceptional 2.8% |
| Immigrants | Guatemala | 95.1 /100 | #99 | Exceptional 2.8% |
| Immigrants | Eastern Africa | 95.0 /100 | #100 | Exceptional 2.8% |
| Immigrants | Spain | 94.9 /100 | #101 | Exceptional 2.8% |
| Taiwanese | 94.8 /100 | #102 | Exceptional 2.8% |
| Immigrants | Indonesia | 94.7 /100 | #103 | Exceptional 2.8% |