Australian vs Immigrants from Ukraine Receiving Food Stamps
COMPARE
Australian
Immigrants from Ukraine
Receiving Food Stamps
Receiving Food Stamps Comparison
Australians
Immigrants from Ukraine
9.6%
RECEIVING FOOD STAMPS
99.4/ 100
METRIC RATING
46th/ 347
METRIC RANK
11.8%
RECEIVING FOOD STAMPS
48.4/ 100
METRIC RATING
177th/ 347
METRIC RANK
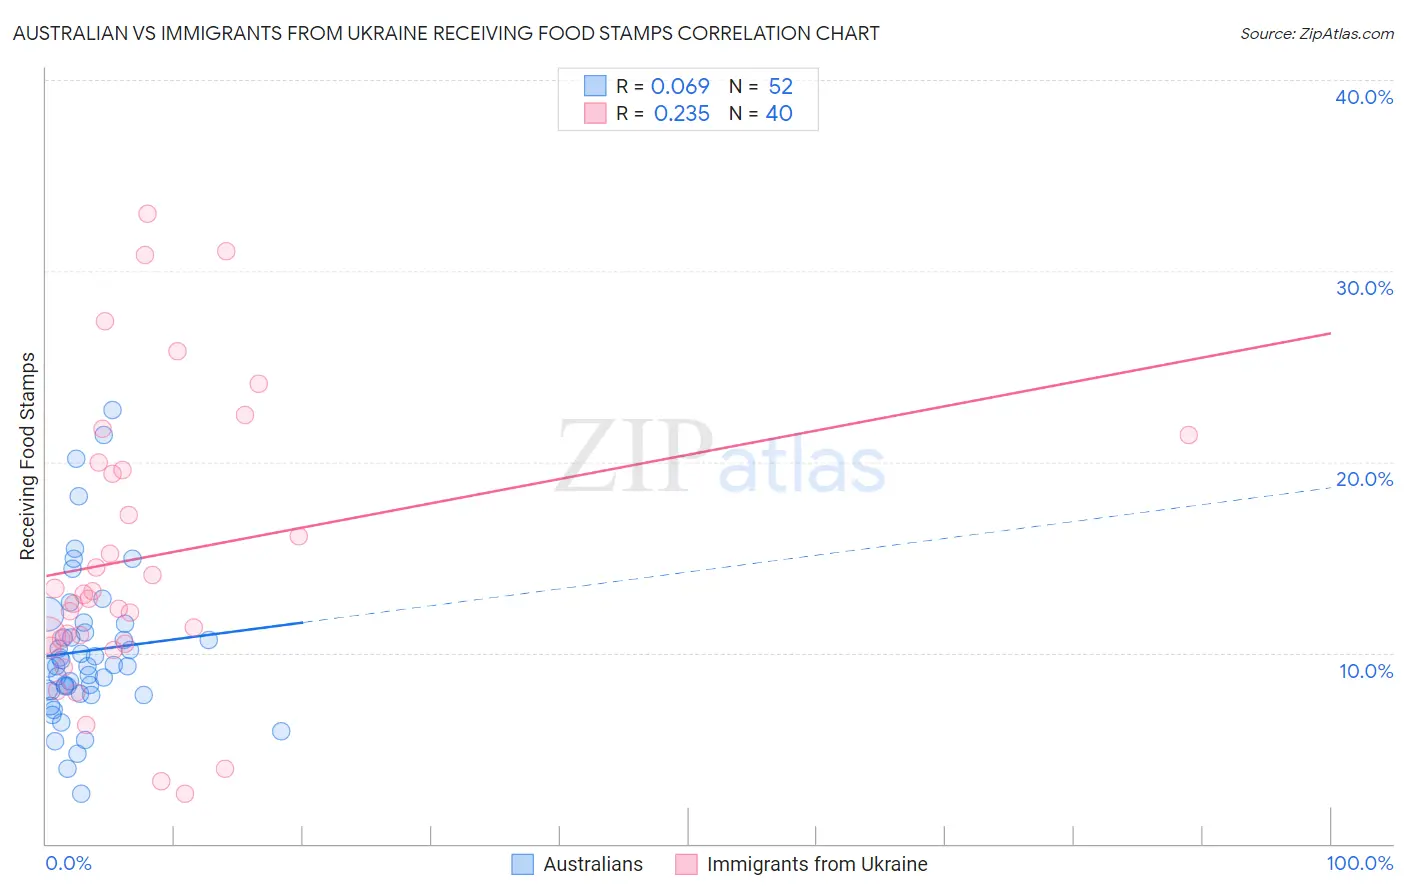
Australian vs Immigrants from Ukraine Receiving Food Stamps Correlation Chart
The statistical analysis conducted on geographies consisting of 223,620,943 people shows a slight positive correlation between the proportion of Australians and percentage of population receiving government assistance and/or food stamps in the United States with a correlation coefficient (R) of 0.069 and weighted average of 9.6%. Similarly, the statistical analysis conducted on geographies consisting of 288,996,069 people shows a weak positive correlation between the proportion of Immigrants from Ukraine and percentage of population receiving government assistance and/or food stamps in the United States with a correlation coefficient (R) of 0.235 and weighted average of 11.8%, a difference of 22.3%.
Receiving Food Stamps Correlation Summary
| Measurement | Australian | Immigrants from Ukraine |
| Minimum | 2.7% | 2.6% |
| Maximum | 22.7% | 33.0% |
| Range | 20.0% | 30.4% |
| Mean | 10.1% | 15.1% |
| Median | 9.3% | 12.9% |
| Interquartile 25% (IQ1) | 7.9% | 10.6% |
| Interquartile 75% (IQ3) | 11.3% | 19.8% |
| Interquartile Range (IQR) | 3.3% | 9.2% |
| Standard Deviation (Sample) | 4.1% | 7.5% |
| Standard Deviation (Population) | 4.0% | 7.4% |
Similar Demographics by Receiving Food Stamps
Demographics Similar to Australians by Receiving Food Stamps
In terms of receiving food stamps, the demographic groups most similar to Australians are Indian (Asian) (9.6%, a difference of 0.070%), Immigrants from Belgium (9.6%, a difference of 0.080%), Immigrants from Denmark (9.6%, a difference of 0.11%), Russian (9.6%, a difference of 0.17%), and Immigrants from Czechoslovakia (9.6%, a difference of 0.19%).
| Demographics | Rating | Rank | Receiving Food Stamps |
| Immigrants | Bolivia | 99.5 /100 | #39 | Exceptional 9.5% |
| Immigrants | Netherlands | 99.5 /100 | #40 | Exceptional 9.5% |
| Cambodians | 99.5 /100 | #41 | Exceptional 9.5% |
| Immigrants | China | 99.5 /100 | #42 | Exceptional 9.6% |
| Croatians | 99.5 /100 | #43 | Exceptional 9.6% |
| Immigrants | Denmark | 99.4 /100 | #44 | Exceptional 9.6% |
| Immigrants | Belgium | 99.4 /100 | #45 | Exceptional 9.6% |
| Australians | 99.4 /100 | #46 | Exceptional 9.6% |
| Indians (Asian) | 99.4 /100 | #47 | Exceptional 9.6% |
| Russians | 99.4 /100 | #48 | Exceptional 9.6% |
| Immigrants | Czechoslovakia | 99.4 /100 | #49 | Exceptional 9.6% |
| Lithuanians | 99.4 /100 | #50 | Exceptional 9.7% |
| Asians | 99.3 /100 | #51 | Exceptional 9.7% |
| Immigrants | South Africa | 99.3 /100 | #52 | Exceptional 9.7% |
| Tongans | 99.3 /100 | #53 | Exceptional 9.7% |
Demographics Similar to Immigrants from Ukraine by Receiving Food Stamps
In terms of receiving food stamps, the demographic groups most similar to Immigrants from Ukraine are German Russian (11.8%, a difference of 0.040%), Peruvian (11.7%, a difference of 0.13%), Osage (11.7%, a difference of 0.21%), Immigrants from Eritrea (11.7%, a difference of 0.23%), and Immigrants from Kenya (11.8%, a difference of 0.28%).
| Demographics | Rating | Rank | Receiving Food Stamps |
| Costa Ricans | 57.9 /100 | #170 | Average 11.6% |
| Immigrants | Western Asia | 56.4 /100 | #171 | Average 11.6% |
| Guamanians/Chamorros | 54.2 /100 | #172 | Average 11.7% |
| Immigrants | Syria | 53.4 /100 | #173 | Average 11.7% |
| Immigrants | Eritrea | 50.0 /100 | #174 | Average 11.7% |
| Osage | 49.8 /100 | #175 | Average 11.7% |
| Peruvians | 49.3 /100 | #176 | Average 11.7% |
| Immigrants | Ukraine | 48.4 /100 | #177 | Average 11.8% |
| German Russians | 48.1 /100 | #178 | Average 11.8% |
| Immigrants | Kenya | 46.4 /100 | #179 | Average 11.8% |
| Uruguayans | 44.8 /100 | #180 | Average 11.8% |
| South American Indians | 41.7 /100 | #181 | Average 11.9% |
| Immigrants | Morocco | 40.7 /100 | #182 | Average 11.9% |
| Immigrants | Uganda | 40.3 /100 | #183 | Average 11.9% |
| Spaniards | 39.8 /100 | #184 | Fair 11.9% |