Shoshone vs Immigrants from Ukraine Hearing Disability
COMPARE
Shoshone
Immigrants from Ukraine
Hearing Disability
Hearing Disability Comparison
Shoshone
Immigrants from Ukraine
4.0%
HEARING DISABILITY
0.0/ 100
METRIC RATING
320th/ 347
METRIC RANK
3.0%
HEARING DISABILITY
56.6/ 100
METRIC RATING
171st/ 347
METRIC RANK
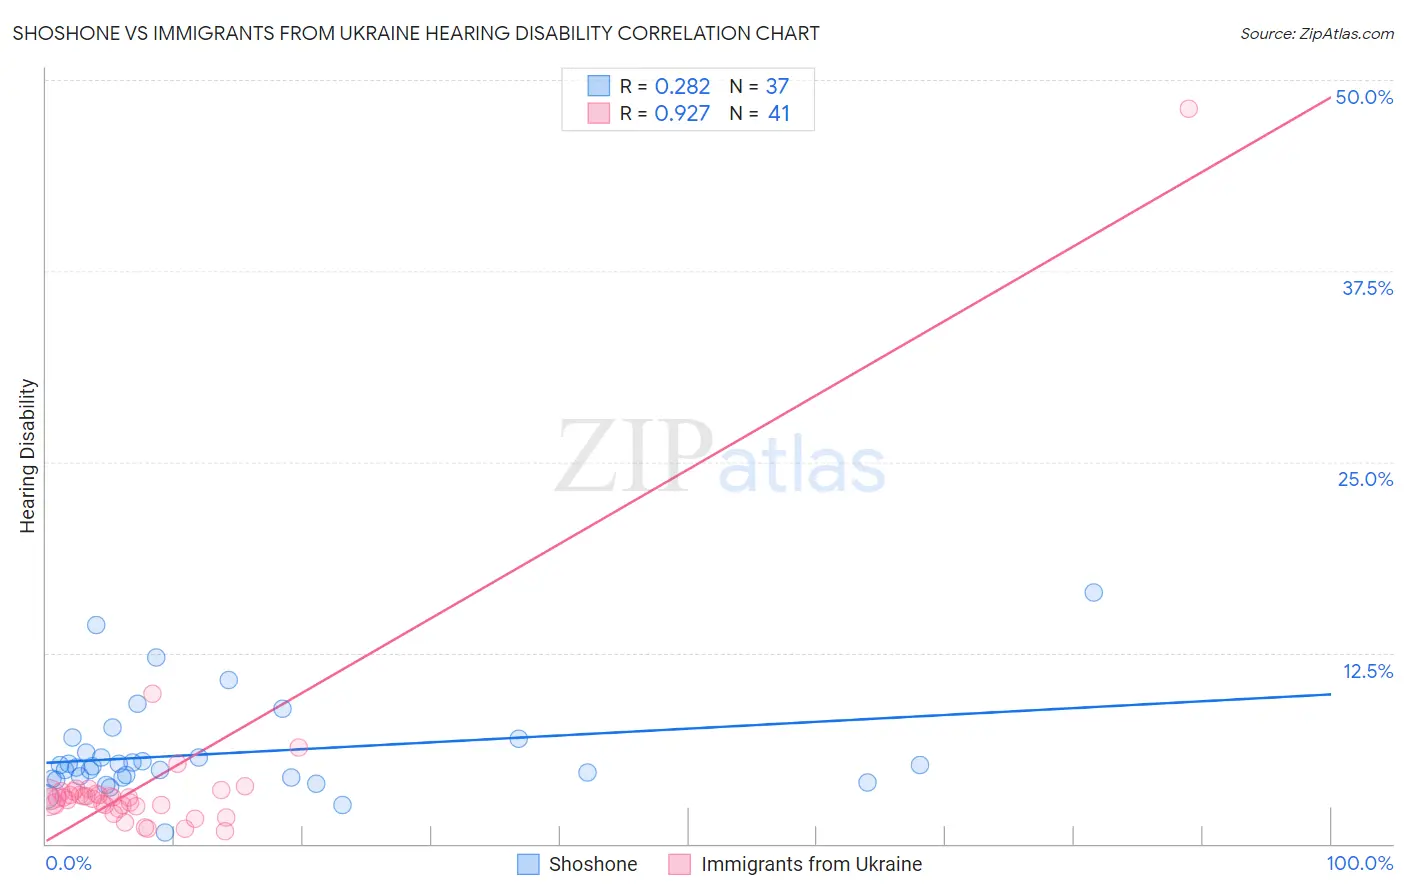
Shoshone vs Immigrants from Ukraine Hearing Disability Correlation Chart
The statistical analysis conducted on geographies consisting of 66,619,523 people shows a weak positive correlation between the proportion of Shoshone and percentage of population with hearing disability in the United States with a correlation coefficient (R) of 0.282 and weighted average of 4.0%. Similarly, the statistical analysis conducted on geographies consisting of 289,631,097 people shows a near-perfect positive correlation between the proportion of Immigrants from Ukraine and percentage of population with hearing disability in the United States with a correlation coefficient (R) of 0.927 and weighted average of 3.0%, a difference of 35.3%.
Hearing Disability Correlation Summary
| Measurement | Shoshone | Immigrants from Ukraine |
| Minimum | 0.77% | 0.79% |
| Maximum | 16.4% | 48.1% |
| Range | 15.7% | 47.4% |
| Mean | 5.9% | 4.1% |
| Median | 5.1% | 3.0% |
| Interquartile 25% (IQ1) | 4.3% | 2.5% |
| Interquartile 75% (IQ3) | 6.4% | 3.3% |
| Interquartile Range (IQR) | 2.1% | 0.84% |
| Standard Deviation (Sample) | 3.1% | 7.2% |
| Standard Deviation (Population) | 3.1% | 7.1% |
Similar Demographics by Hearing Disability
Demographics Similar to Shoshone by Hearing Disability
In terms of hearing disability, the demographic groups most similar to Shoshone are Chippewa (4.0%, a difference of 0.81%), Paiute (4.1%, a difference of 1.2%), Cheyenne (4.0%, a difference of 1.5%), Seminole (4.1%, a difference of 1.5%), and Comanche (4.0%, a difference of 1.6%).
| Demographics | Rating | Rank | Hearing Disability |
| Hopi | 0.0 /100 | #313 | Tragic 3.9% |
| Yakama | 0.0 /100 | #314 | Tragic 3.9% |
| Puget Sound Salish | 0.0 /100 | #315 | Tragic 3.9% |
| Spanish Americans | 0.0 /100 | #316 | Tragic 4.0% |
| Comanche | 0.0 /100 | #317 | Tragic 4.0% |
| Cheyenne | 0.0 /100 | #318 | Tragic 4.0% |
| Chippewa | 0.0 /100 | #319 | Tragic 4.0% |
| Shoshone | 0.0 /100 | #320 | Tragic 4.0% |
| Paiute | 0.0 /100 | #321 | Tragic 4.1% |
| Seminole | 0.0 /100 | #322 | Tragic 4.1% |
| Apache | 0.0 /100 | #323 | Tragic 4.1% |
| Osage | 0.0 /100 | #324 | Tragic 4.1% |
| Lumbee | 0.0 /100 | #325 | Tragic 4.1% |
| Potawatomi | 0.0 /100 | #326 | Tragic 4.1% |
| Arapaho | 0.0 /100 | #327 | Tragic 4.1% |
Demographics Similar to Immigrants from Ukraine by Hearing Disability
In terms of hearing disability, the demographic groups most similar to Immigrants from Ukraine are Immigrants from Cabo Verde (3.0%, a difference of 0.030%), Armenian (3.0%, a difference of 0.060%), Arab (3.0%, a difference of 0.10%), Immigrants from Greece (3.0%, a difference of 0.12%), and Immigrants from Eastern Europe (3.0%, a difference of 0.14%).
| Demographics | Rating | Rank | Hearing Disability |
| Immigrants | Cambodia | 64.8 /100 | #164 | Good 3.0% |
| Immigrants | Zimbabwe | 64.2 /100 | #165 | Good 3.0% |
| Immigrants | South Eastern Asia | 62.9 /100 | #166 | Good 3.0% |
| Immigrants | Eastern Europe | 58.1 /100 | #167 | Average 3.0% |
| Immigrants | Greece | 57.9 /100 | #168 | Average 3.0% |
| Arabs | 57.6 /100 | #169 | Average 3.0% |
| Immigrants | Cabo Verde | 56.9 /100 | #170 | Average 3.0% |
| Immigrants | Ukraine | 56.6 /100 | #171 | Average 3.0% |
| Armenians | 56.0 /100 | #172 | Average 3.0% |
| Immigrants | Serbia | 51.1 /100 | #173 | Average 3.0% |
| Indonesians | 50.0 /100 | #174 | Average 3.0% |
| Immigrants | Romania | 48.4 /100 | #175 | Average 3.0% |
| Panamanians | 47.0 /100 | #176 | Average 3.0% |
| Immigrants | Philippines | 46.4 /100 | #177 | Average 3.0% |
| Japanese | 46.0 /100 | #178 | Average 3.0% |