Australian vs Immigrants from Bahamas Currently Married
COMPARE
Australian
Immigrants from Bahamas
Currently Married
Currently Married Comparison
Australians
Immigrants from Bahamas
47.6%
CURRENTLY MARRIED
90.2/ 100
METRIC RATING
119th/ 347
METRIC RANK
41.9%
CURRENTLY MARRIED
0.0/ 100
METRIC RATING
304th/ 347
METRIC RANK
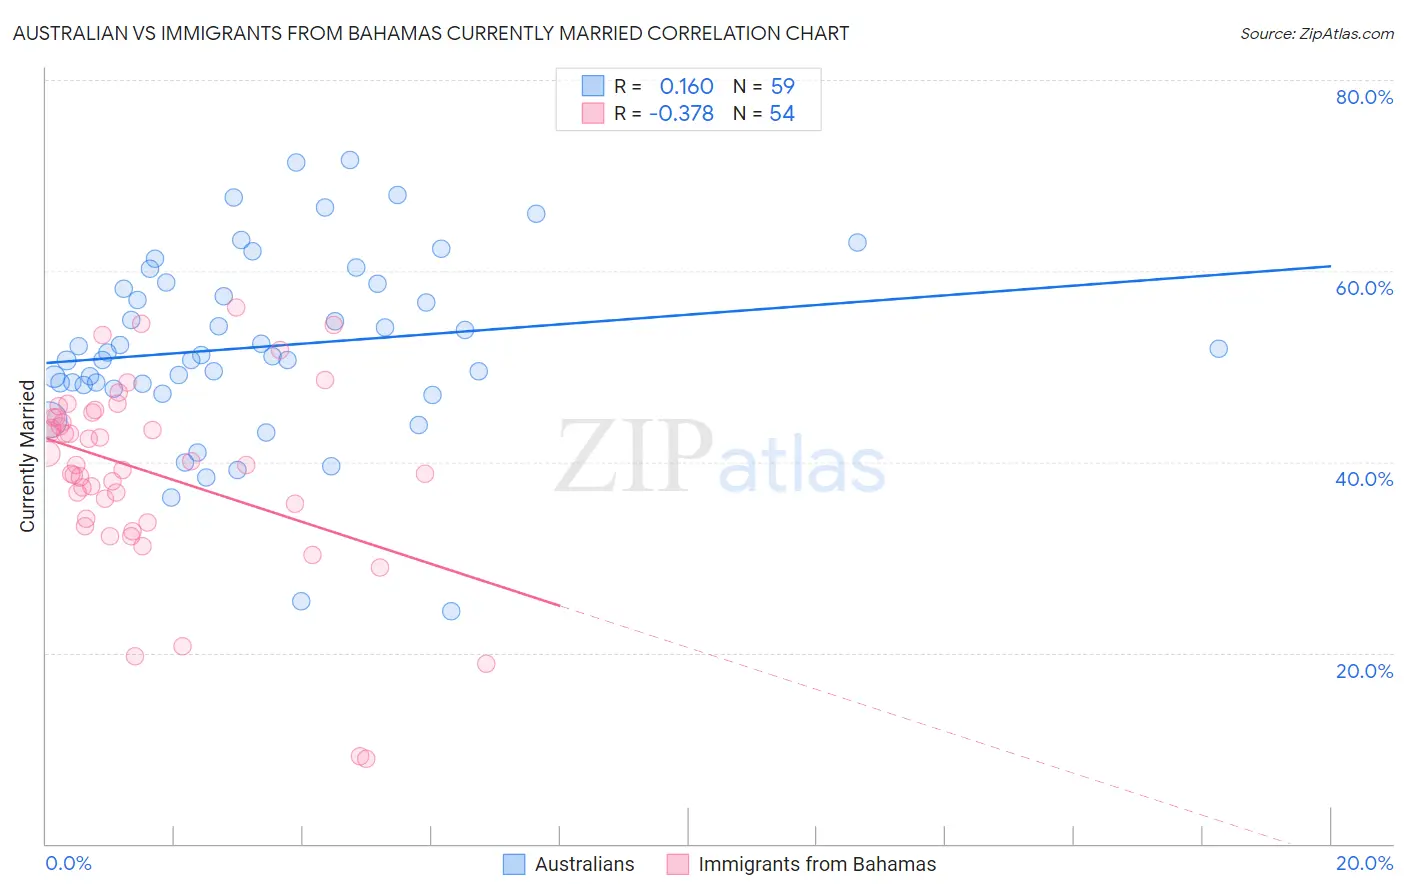
Australian vs Immigrants from Bahamas Currently Married Correlation Chart
The statistical analysis conducted on geographies consisting of 224,121,967 people shows a poor positive correlation between the proportion of Australians and percentage of population currently married in the United States with a correlation coefficient (R) of 0.160 and weighted average of 47.6%. Similarly, the statistical analysis conducted on geographies consisting of 104,648,272 people shows a mild negative correlation between the proportion of Immigrants from Bahamas and percentage of population currently married in the United States with a correlation coefficient (R) of -0.378 and weighted average of 41.9%, a difference of 13.6%.
Currently Married Correlation Summary
| Measurement | Australian | Immigrants from Bahamas |
| Minimum | 24.4% | 8.9% |
| Maximum | 71.6% | 56.2% |
| Range | 47.2% | 47.3% |
| Mean | 52.1% | 38.9% |
| Median | 51.2% | 39.7% |
| Interquartile 25% (IQ1) | 48.1% | 34.0% |
| Interquartile 75% (IQ3) | 58.6% | 44.7% |
| Interquartile Range (IQR) | 10.6% | 10.6% |
| Standard Deviation (Sample) | 9.7% | 9.9% |
| Standard Deviation (Population) | 9.6% | 9.8% |
Similar Demographics by Currently Married
Demographics Similar to Australians by Currently Married
In terms of currently married, the demographic groups most similar to Australians are Immigrants from Philippines (47.6%, a difference of 0.0%), Puget Sound Salish (47.6%, a difference of 0.010%), Palestinian (47.6%, a difference of 0.020%), Immigrants from Indonesia (47.6%, a difference of 0.030%), and South African (47.6%, a difference of 0.040%).
| Demographics | Rating | Rank | Currently Married |
| Immigrants | Western Europe | 91.1 /100 | #112 | Exceptional 47.6% |
| Immigrants | Denmark | 90.9 /100 | #113 | Exceptional 47.6% |
| South Africans | 90.5 /100 | #114 | Exceptional 47.6% |
| Immigrants | Indonesia | 90.5 /100 | #115 | Exceptional 47.6% |
| Palestinians | 90.4 /100 | #116 | Exceptional 47.6% |
| Puget Sound Salish | 90.3 /100 | #117 | Exceptional 47.6% |
| Immigrants | Philippines | 90.2 /100 | #118 | Exceptional 47.6% |
| Australians | 90.2 /100 | #119 | Exceptional 47.6% |
| Syrians | 88.9 /100 | #120 | Excellent 47.5% |
| Immigrants | Croatia | 88.6 /100 | #121 | Excellent 47.5% |
| Osage | 87.9 /100 | #122 | Excellent 47.5% |
| Immigrants | Kazakhstan | 87.2 /100 | #123 | Excellent 47.4% |
| Laotians | 86.6 /100 | #124 | Excellent 47.4% |
| Okinawans | 85.3 /100 | #125 | Excellent 47.4% |
| Immigrants | Jordan | 84.9 /100 | #126 | Excellent 47.4% |
Demographics Similar to Immigrants from Bahamas by Currently Married
In terms of currently married, the demographic groups most similar to Immigrants from Bahamas are Immigrants from Trinidad and Tobago (41.9%, a difference of 0.030%), Immigrants from Guyana (41.9%, a difference of 0.040%), Sioux (41.9%, a difference of 0.11%), Immigrants from Zaire (42.0%, a difference of 0.13%), and African (41.8%, a difference of 0.18%).
| Demographics | Rating | Rank | Currently Married |
| Cheyenne | 0.0 /100 | #297 | Tragic 42.2% |
| Immigrants | Honduras | 0.0 /100 | #298 | Tragic 42.2% |
| Liberians | 0.0 /100 | #299 | Tragic 42.2% |
| Belizeans | 0.0 /100 | #300 | Tragic 42.2% |
| Immigrants | Yemen | 0.0 /100 | #301 | Tragic 42.1% |
| Immigrants | Zaire | 0.0 /100 | #302 | Tragic 42.0% |
| Sioux | 0.0 /100 | #303 | Tragic 41.9% |
| Immigrants | Bahamas | 0.0 /100 | #304 | Tragic 41.9% |
| Immigrants | Trinidad and Tobago | 0.0 /100 | #305 | Tragic 41.9% |
| Immigrants | Guyana | 0.0 /100 | #306 | Tragic 41.9% |
| Africans | 0.0 /100 | #307 | Tragic 41.8% |
| Immigrants | Belize | 0.0 /100 | #308 | Tragic 41.8% |
| Immigrants | Liberia | 0.0 /100 | #309 | Tragic 41.8% |
| Guyanese | 0.0 /100 | #310 | Tragic 41.6% |
| Trinidadians and Tobagonians | 0.0 /100 | #311 | Tragic 41.5% |