Assyrian/Chaldean/Syriac vs Senegalese Disability Age 35 to 64
COMPARE
Assyrian/Chaldean/Syriac
Senegalese
Disability Age 35 to 64
Disability Age 35 to 64 Comparison
Assyrians/Chaldeans/Syriacs
Senegalese
10.5%
DISABILITY AGE 35 TO 64
96.8/ 100
METRIC RATING
112th/ 347
METRIC RANK
12.5%
DISABILITY AGE 35 TO 64
0.5/ 100
METRIC RATING
262nd/ 347
METRIC RANK
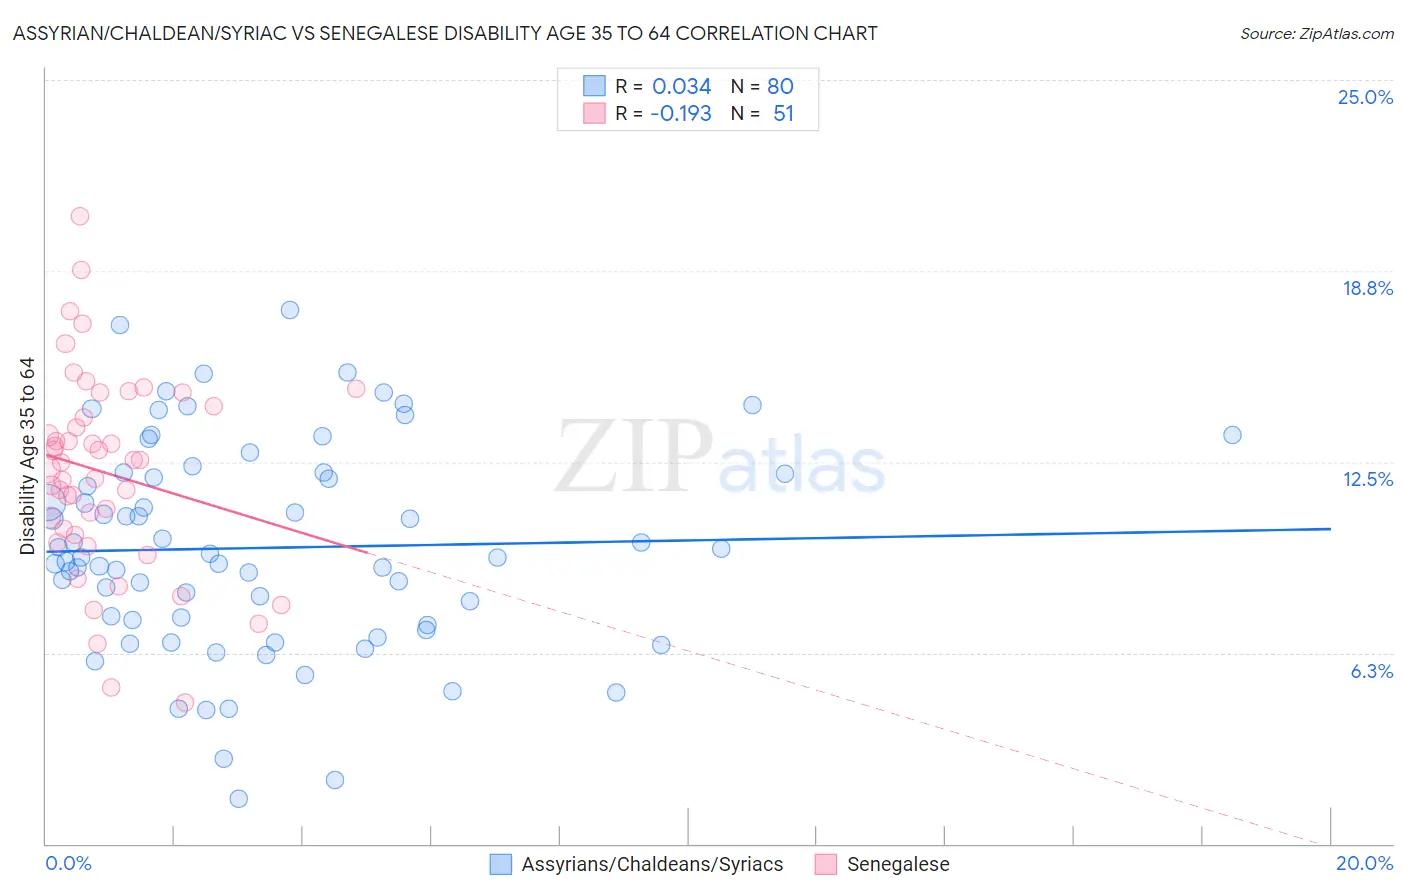
Assyrian/Chaldean/Syriac vs Senegalese Disability Age 35 to 64 Correlation Chart
The statistical analysis conducted on geographies consisting of 110,296,626 people shows no correlation between the proportion of Assyrians/Chaldeans/Syriacs and percentage of population with a disability between the ages 34 and 64 in the United States with a correlation coefficient (R) of 0.034 and weighted average of 10.5%. Similarly, the statistical analysis conducted on geographies consisting of 78,098,003 people shows a poor negative correlation between the proportion of Senegalese and percentage of population with a disability between the ages 34 and 64 in the United States with a correlation coefficient (R) of -0.193 and weighted average of 12.5%, a difference of 19.0%.
Disability Age 35 to 64 Correlation Summary
| Measurement | Assyrian/Chaldean/Syriac | Senegalese |
| Minimum | 1.5% | 4.6% |
| Maximum | 17.5% | 20.5% |
| Range | 16.0% | 15.9% |
| Mean | 9.7% | 12.1% |
| Median | 9.4% | 12.5% |
| Interquartile 25% (IQ1) | 7.2% | 10.1% |
| Interquartile 75% (IQ3) | 12.1% | 14.3% |
| Interquartile Range (IQR) | 4.9% | 4.2% |
| Standard Deviation (Sample) | 3.4% | 3.3% |
| Standard Deviation (Population) | 3.4% | 3.2% |
Similar Demographics by Disability Age 35 to 64
Demographics Similar to Assyrians/Chaldeans/Syriacs by Disability Age 35 to 64
In terms of disability age 35 to 64, the demographic groups most similar to Assyrians/Chaldeans/Syriacs are Brazilian (10.5%, a difference of 0.030%), Tongan (10.5%, a difference of 0.12%), Immigrants from Morocco (10.5%, a difference of 0.17%), Korean (10.5%, a difference of 0.24%), and Immigrants from Ethiopia (10.5%, a difference of 0.30%).
| Demographics | Rating | Rank | Disability Age 35 to 64 |
| Macedonians | 97.8 /100 | #105 | Exceptional 10.4% |
| Immigrants | Hungary | 97.6 /100 | #106 | Exceptional 10.4% |
| Zimbabweans | 97.4 /100 | #107 | Exceptional 10.4% |
| Ethiopians | 97.4 /100 | #108 | Exceptional 10.5% |
| Immigrants | Ethiopia | 97.2 /100 | #109 | Exceptional 10.5% |
| Koreans | 97.1 /100 | #110 | Exceptional 10.5% |
| Brazilians | 96.9 /100 | #111 | Exceptional 10.5% |
| Assyrians/Chaldeans/Syriacs | 96.8 /100 | #112 | Exceptional 10.5% |
| Tongans | 96.6 /100 | #113 | Exceptional 10.5% |
| Immigrants | Morocco | 96.6 /100 | #114 | Exceptional 10.5% |
| Immigrants | Netherlands | 96.3 /100 | #115 | Exceptional 10.5% |
| Immigrants | Nepal | 95.9 /100 | #116 | Exceptional 10.6% |
| Immigrants | South Eastern Asia | 95.7 /100 | #117 | Exceptional 10.6% |
| Immigrants | Moldova | 95.5 /100 | #118 | Exceptional 10.6% |
| Luxembourgers | 95.5 /100 | #119 | Exceptional 10.6% |
Demographics Similar to Senegalese by Disability Age 35 to 64
In terms of disability age 35 to 64, the demographic groups most similar to Senegalese are Malaysian (12.5%, a difference of 0.080%), German Russian (12.5%, a difference of 0.23%), Immigrants from Zaire (12.5%, a difference of 0.25%), Immigrants from Portugal (12.5%, a difference of 0.26%), and Marshallese (12.5%, a difference of 0.37%).
| Demographics | Rating | Rank | Disability Age 35 to 64 |
| Japanese | 0.8 /100 | #255 | Tragic 12.3% |
| Scottish | 0.8 /100 | #256 | Tragic 12.4% |
| Mexicans | 0.7 /100 | #257 | Tragic 12.4% |
| Welsh | 0.6 /100 | #258 | Tragic 12.4% |
| English | 0.6 /100 | #259 | Tragic 12.4% |
| German Russians | 0.5 /100 | #260 | Tragic 12.5% |
| Malaysians | 0.5 /100 | #261 | Tragic 12.5% |
| Senegalese | 0.5 /100 | #262 | Tragic 12.5% |
| Immigrants | Zaire | 0.4 /100 | #263 | Tragic 12.5% |
| Immigrants | Portugal | 0.4 /100 | #264 | Tragic 12.5% |
| Marshallese | 0.4 /100 | #265 | Tragic 12.5% |
| Whites/Caucasians | 0.3 /100 | #266 | Tragic 12.6% |
| Sub-Saharan Africans | 0.2 /100 | #267 | Tragic 12.6% |
| Immigrants | Dominica | 0.2 /100 | #268 | Tragic 12.7% |
| Spanish | 0.2 /100 | #269 | Tragic 12.7% |