Assyrian/Chaldean/Syriac vs Immigrants from El Salvador Disability Age 35 to 64
COMPARE
Assyrian/Chaldean/Syriac
Immigrants from El Salvador
Disability Age 35 to 64
Disability Age 35 to 64 Comparison
Assyrians/Chaldeans/Syriacs
Immigrants from El Salvador
10.5%
DISABILITY AGE 35 TO 64
96.8/ 100
METRIC RATING
112th/ 347
METRIC RANK
10.7%
DISABILITY AGE 35 TO 64
92.8/ 100
METRIC RATING
131st/ 347
METRIC RANK
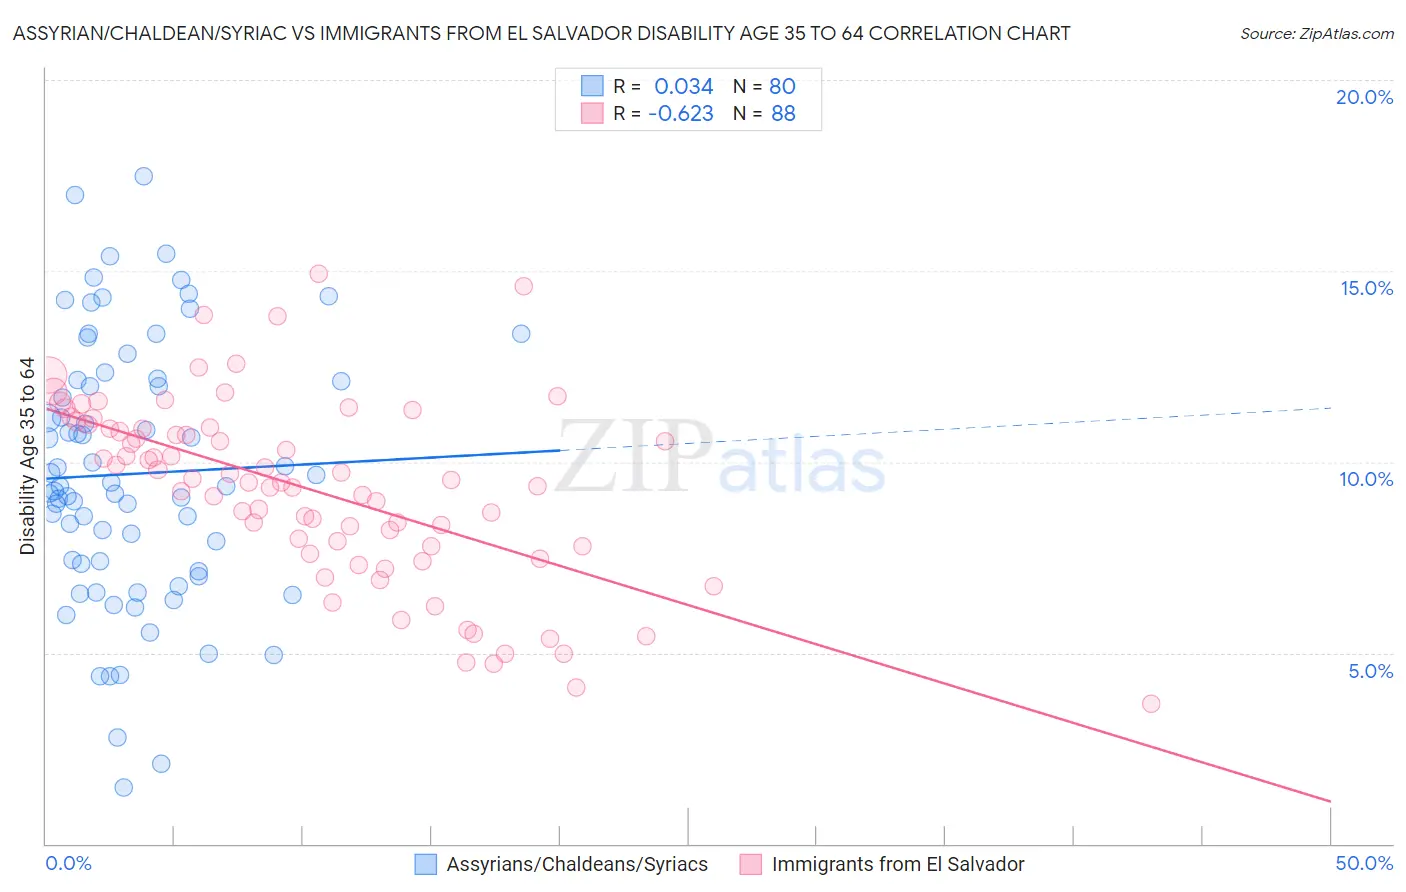
Assyrian/Chaldean/Syriac vs Immigrants from El Salvador Disability Age 35 to 64 Correlation Chart
The statistical analysis conducted on geographies consisting of 110,296,626 people shows no correlation between the proportion of Assyrians/Chaldeans/Syriacs and percentage of population with a disability between the ages 34 and 64 in the United States with a correlation coefficient (R) of 0.034 and weighted average of 10.5%. Similarly, the statistical analysis conducted on geographies consisting of 357,685,552 people shows a significant negative correlation between the proportion of Immigrants from El Salvador and percentage of population with a disability between the ages 34 and 64 in the United States with a correlation coefficient (R) of -0.623 and weighted average of 10.7%, a difference of 1.8%.
Disability Age 35 to 64 Correlation Summary
| Measurement | Assyrian/Chaldean/Syriac | Immigrants from El Salvador |
| Minimum | 1.5% | 3.7% |
| Maximum | 17.5% | 14.9% |
| Range | 16.0% | 11.3% |
| Mean | 9.7% | 9.3% |
| Median | 9.4% | 9.5% |
| Interquartile 25% (IQ1) | 7.2% | 7.8% |
| Interquartile 75% (IQ3) | 12.1% | 10.9% |
| Interquartile Range (IQR) | 4.9% | 3.1% |
| Standard Deviation (Sample) | 3.4% | 2.4% |
| Standard Deviation (Population) | 3.4% | 2.4% |
Demographics Similar to Assyrians/Chaldeans/Syriacs and Immigrants from El Salvador by Disability Age 35 to 64
In terms of disability age 35 to 64, the demographic groups most similar to Assyrians/Chaldeans/Syriacs are Brazilian (10.5%, a difference of 0.030%), Tongan (10.5%, a difference of 0.12%), Immigrants from Morocco (10.5%, a difference of 0.17%), Immigrants from Netherlands (10.5%, a difference of 0.34%), and Immigrants from Nepal (10.6%, a difference of 0.57%). Similarly, the demographic groups most similar to Immigrants from El Salvador are Immigrants from Syria (10.7%, a difference of 0.050%), Ecuadorian (10.7%, a difference of 0.080%), South African (10.7%, a difference of 0.16%), Immigrants from Zimbabwe (10.6%, a difference of 0.40%), and Immigrants from Afghanistan (10.6%, a difference of 0.44%).
| Demographics | Rating | Rank | Disability Age 35 to 64 |
| Brazilians | 96.9 /100 | #111 | Exceptional 10.5% |
| Assyrians/Chaldeans/Syriacs | 96.8 /100 | #112 | Exceptional 10.5% |
| Tongans | 96.6 /100 | #113 | Exceptional 10.5% |
| Immigrants | Morocco | 96.6 /100 | #114 | Exceptional 10.5% |
| Immigrants | Netherlands | 96.3 /100 | #115 | Exceptional 10.5% |
| Immigrants | Nepal | 95.9 /100 | #116 | Exceptional 10.6% |
| Immigrants | South Eastern Asia | 95.7 /100 | #117 | Exceptional 10.6% |
| Immigrants | Moldova | 95.5 /100 | #118 | Exceptional 10.6% |
| Luxembourgers | 95.5 /100 | #119 | Exceptional 10.6% |
| Vietnamese | 95.4 /100 | #120 | Exceptional 10.6% |
| Romanians | 95.0 /100 | #121 | Exceptional 10.6% |
| Immigrants | Norway | 95.0 /100 | #122 | Exceptional 10.6% |
| Maltese | 94.8 /100 | #123 | Exceptional 10.6% |
| Estonians | 94.5 /100 | #124 | Exceptional 10.6% |
| Albanians | 94.2 /100 | #125 | Exceptional 10.6% |
| Immigrants | Afghanistan | 94.1 /100 | #126 | Exceptional 10.6% |
| Immigrants | Zimbabwe | 94.0 /100 | #127 | Exceptional 10.6% |
| South Africans | 93.3 /100 | #128 | Exceptional 10.7% |
| Ecuadorians | 93.1 /100 | #129 | Exceptional 10.7% |
| Immigrants | Syria | 93.0 /100 | #130 | Exceptional 10.7% |
| Immigrants | El Salvador | 92.8 /100 | #131 | Exceptional 10.7% |