Assyrian/Chaldean/Syriac vs Blackfeet Disability Age 35 to 64
COMPARE
Assyrian/Chaldean/Syriac
Blackfeet
Disability Age 35 to 64
Disability Age 35 to 64 Comparison
Assyrians/Chaldeans/Syriacs
Blackfeet
10.5%
DISABILITY AGE 35 TO 64
96.8/ 100
METRIC RATING
112th/ 347
METRIC RANK
14.1%
DISABILITY AGE 35 TO 64
0.0/ 100
METRIC RATING
307th/ 347
METRIC RANK
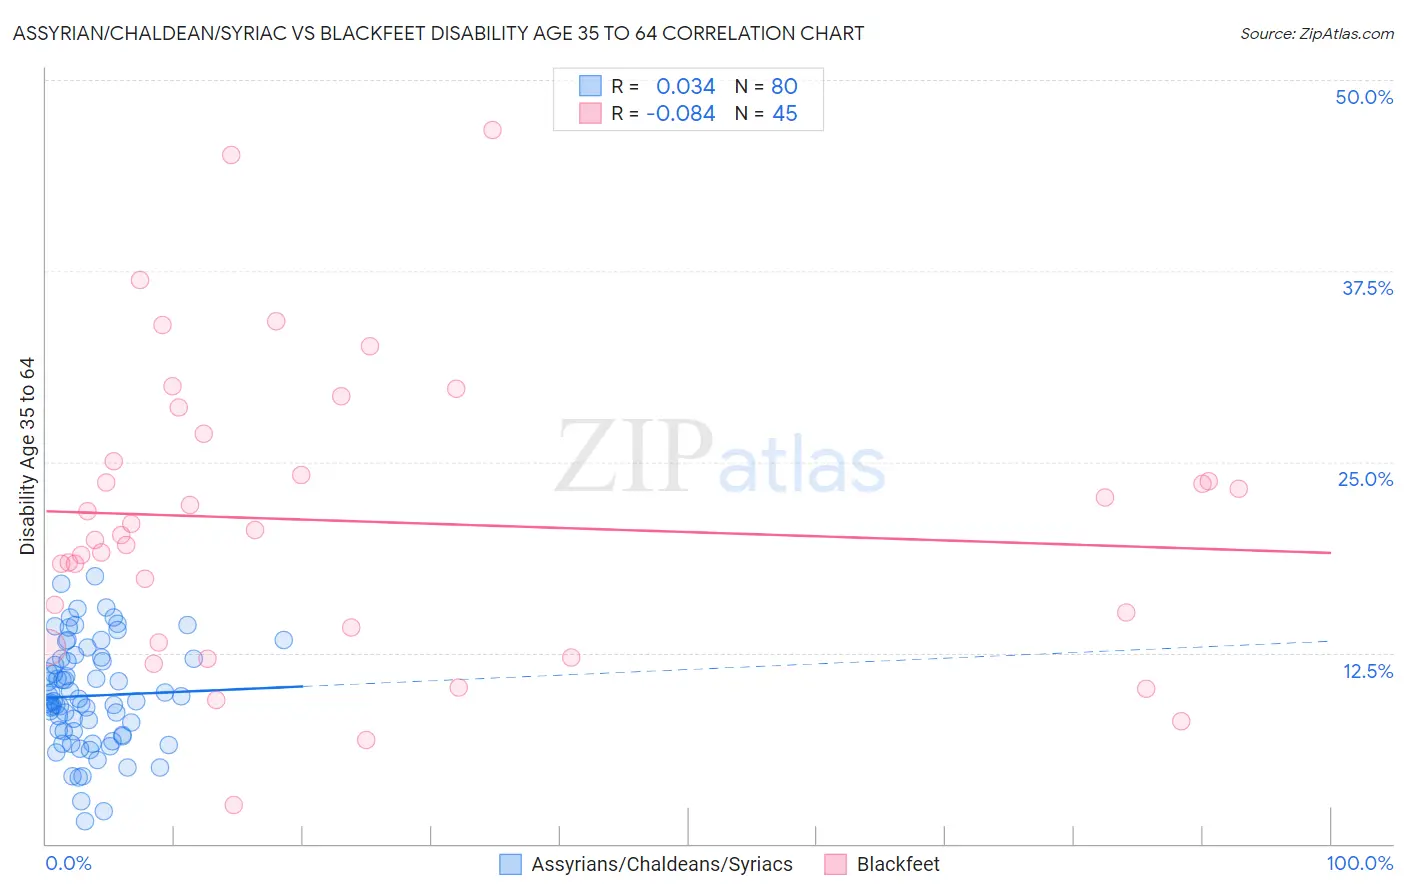
Assyrian/Chaldean/Syriac vs Blackfeet Disability Age 35 to 64 Correlation Chart
The statistical analysis conducted on geographies consisting of 110,296,626 people shows no correlation between the proportion of Assyrians/Chaldeans/Syriacs and percentage of population with a disability between the ages 34 and 64 in the United States with a correlation coefficient (R) of 0.034 and weighted average of 10.5%. Similarly, the statistical analysis conducted on geographies consisting of 309,440,596 people shows a slight negative correlation between the proportion of Blackfeet and percentage of population with a disability between the ages 34 and 64 in the United States with a correlation coefficient (R) of -0.084 and weighted average of 14.1%, a difference of 33.9%.
Disability Age 35 to 64 Correlation Summary
| Measurement | Assyrian/Chaldean/Syriac | Blackfeet |
| Minimum | 1.5% | 2.5% |
| Maximum | 17.5% | 46.7% |
| Range | 16.0% | 44.2% |
| Mean | 9.7% | 21.1% |
| Median | 9.4% | 20.2% |
| Interquartile 25% (IQ1) | 7.2% | 13.7% |
| Interquartile 75% (IQ3) | 12.1% | 25.9% |
| Interquartile Range (IQR) | 4.9% | 12.3% |
| Standard Deviation (Sample) | 3.4% | 9.5% |
| Standard Deviation (Population) | 3.4% | 9.4% |
Similar Demographics by Disability Age 35 to 64
Demographics Similar to Assyrians/Chaldeans/Syriacs by Disability Age 35 to 64
In terms of disability age 35 to 64, the demographic groups most similar to Assyrians/Chaldeans/Syriacs are Brazilian (10.5%, a difference of 0.030%), Tongan (10.5%, a difference of 0.12%), Immigrants from Morocco (10.5%, a difference of 0.17%), Korean (10.5%, a difference of 0.24%), and Immigrants from Ethiopia (10.5%, a difference of 0.30%).
| Demographics | Rating | Rank | Disability Age 35 to 64 |
| Macedonians | 97.8 /100 | #105 | Exceptional 10.4% |
| Immigrants | Hungary | 97.6 /100 | #106 | Exceptional 10.4% |
| Zimbabweans | 97.4 /100 | #107 | Exceptional 10.4% |
| Ethiopians | 97.4 /100 | #108 | Exceptional 10.5% |
| Immigrants | Ethiopia | 97.2 /100 | #109 | Exceptional 10.5% |
| Koreans | 97.1 /100 | #110 | Exceptional 10.5% |
| Brazilians | 96.9 /100 | #111 | Exceptional 10.5% |
| Assyrians/Chaldeans/Syriacs | 96.8 /100 | #112 | Exceptional 10.5% |
| Tongans | 96.6 /100 | #113 | Exceptional 10.5% |
| Immigrants | Morocco | 96.6 /100 | #114 | Exceptional 10.5% |
| Immigrants | Netherlands | 96.3 /100 | #115 | Exceptional 10.5% |
| Immigrants | Nepal | 95.9 /100 | #116 | Exceptional 10.6% |
| Immigrants | South Eastern Asia | 95.7 /100 | #117 | Exceptional 10.6% |
| Immigrants | Moldova | 95.5 /100 | #118 | Exceptional 10.6% |
| Luxembourgers | 95.5 /100 | #119 | Exceptional 10.6% |
Demographics Similar to Blackfeet by Disability Age 35 to 64
In terms of disability age 35 to 64, the demographic groups most similar to Blackfeet are Inupiat (14.1%, a difference of 0.030%), Cree (14.1%, a difference of 0.10%), Immigrants from Yemen (14.0%, a difference of 0.16%), Cape Verdean (14.1%, a difference of 0.57%), and American (13.9%, a difference of 1.0%).
| Demographics | Rating | Rank | Disability Age 35 to 64 |
| Delaware | 0.0 /100 | #300 | Tragic 13.7% |
| French American Indians | 0.0 /100 | #301 | Tragic 13.7% |
| Aleuts | 0.0 /100 | #302 | Tragic 13.8% |
| Sioux | 0.0 /100 | #303 | Tragic 13.9% |
| Hopi | 0.0 /100 | #304 | Tragic 13.9% |
| Americans | 0.0 /100 | #305 | Tragic 13.9% |
| Immigrants | Yemen | 0.0 /100 | #306 | Tragic 14.0% |
| Blackfeet | 0.0 /100 | #307 | Tragic 14.1% |
| Inupiat | 0.0 /100 | #308 | Tragic 14.1% |
| Cree | 0.0 /100 | #309 | Tragic 14.1% |
| Cape Verdeans | 0.0 /100 | #310 | Tragic 14.1% |
| Immigrants | Azores | 0.0 /100 | #311 | Tragic 14.3% |
| Paiute | 0.0 /100 | #312 | Tragic 14.3% |
| Iroquois | 0.0 /100 | #313 | Tragic 14.4% |
| Shoshone | 0.0 /100 | #314 | Tragic 14.5% |