Assyrian/Chaldean/Syriac vs Yugoslavian No Schooling Completed
COMPARE
Assyrian/Chaldean/Syriac
Yugoslavian
No Schooling Completed
No Schooling Completed Comparison
Assyrians/Chaldeans/Syriacs
Yugoslavians
2.5%
NO SCHOOLING COMPLETED
0.6/ 100
METRIC RATING
258th/ 347
METRIC RANK
1.8%
NO SCHOOLING COMPLETED
97.2/ 100
METRIC RATING
107th/ 347
METRIC RANK
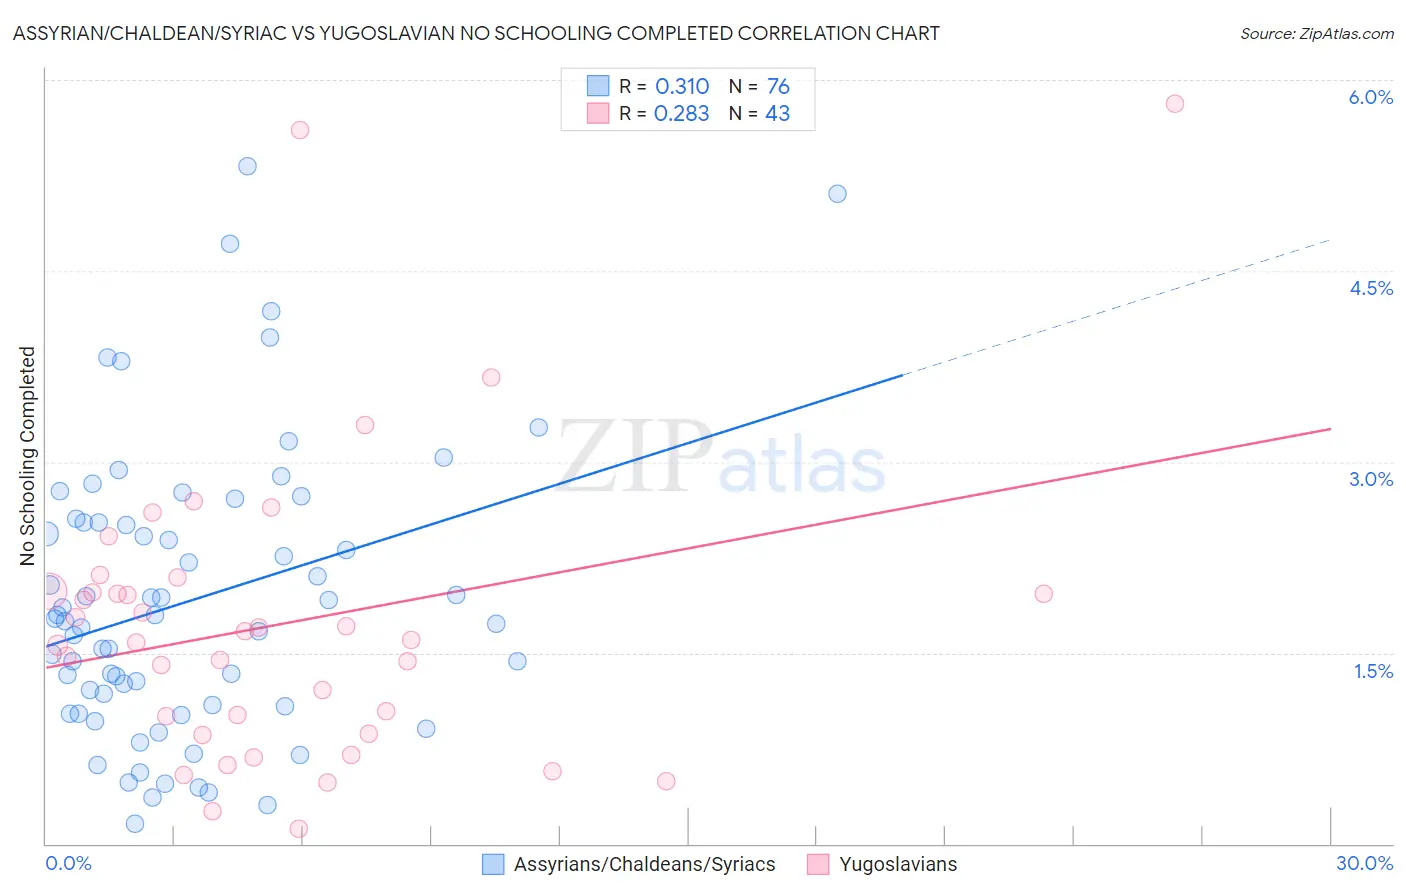
Assyrian/Chaldean/Syriac vs Yugoslavian No Schooling Completed Correlation Chart
The statistical analysis conducted on geographies consisting of 110,066,308 people shows a mild positive correlation between the proportion of Assyrians/Chaldeans/Syriacs and percentage of population with no schooling in the United States with a correlation coefficient (R) of 0.310 and weighted average of 2.5%. Similarly, the statistical analysis conducted on geographies consisting of 283,637,771 people shows a weak positive correlation between the proportion of Yugoslavians and percentage of population with no schooling in the United States with a correlation coefficient (R) of 0.283 and weighted average of 1.8%, a difference of 33.2%.
No Schooling Completed Correlation Summary
| Measurement | Assyrian/Chaldean/Syriac | Yugoslavian |
| Minimum | 0.15% | 0.12% |
| Maximum | 5.3% | 5.8% |
| Range | 5.2% | 5.7% |
| Mean | 1.9% | 1.7% |
| Median | 1.8% | 1.6% |
| Interquartile 25% (IQ1) | 1.1% | 0.86% |
| Interquartile 75% (IQ3) | 2.5% | 2.0% |
| Interquartile Range (IQR) | 1.4% | 1.1% |
| Standard Deviation (Sample) | 1.1% | 1.2% |
| Standard Deviation (Population) | 1.1% | 1.2% |
Similar Demographics by No Schooling Completed
Demographics Similar to Assyrians/Chaldeans/Syriacs by No Schooling Completed
In terms of no schooling completed, the demographic groups most similar to Assyrians/Chaldeans/Syriacs are Immigrants from South America (2.5%, a difference of 0.030%), Immigrants from Jamaica (2.5%, a difference of 0.060%), Immigrants from Ethiopia (2.5%, a difference of 0.11%), Armenian (2.5%, a difference of 0.23%), and Immigrants from Sierra Leone (2.5%, a difference of 0.58%).
| Demographics | Rating | Rank | No Schooling Completed |
| Immigrants | Africa | 1.1 /100 | #251 | Tragic 2.4% |
| Immigrants | Colombia | 1.0 /100 | #252 | Tragic 2.4% |
| Immigrants | Asia | 0.9 /100 | #253 | Tragic 2.4% |
| Immigrants | Eastern Africa | 0.9 /100 | #254 | Tragic 2.4% |
| Ethiopians | 0.8 /100 | #255 | Tragic 2.4% |
| Yaqui | 0.8 /100 | #256 | Tragic 2.4% |
| Immigrants | South America | 0.6 /100 | #257 | Tragic 2.5% |
| Assyrians/Chaldeans/Syriacs | 0.6 /100 | #258 | Tragic 2.5% |
| Immigrants | Jamaica | 0.6 /100 | #259 | Tragic 2.5% |
| Immigrants | Ethiopia | 0.6 /100 | #260 | Tragic 2.5% |
| Armenians | 0.5 /100 | #261 | Tragic 2.5% |
| Immigrants | Sierra Leone | 0.5 /100 | #262 | Tragic 2.5% |
| Immigrants | Liberia | 0.4 /100 | #263 | Tragic 2.5% |
| Indians (Asian) | 0.4 /100 | #264 | Tragic 2.5% |
| West Indians | 0.4 /100 | #265 | Tragic 2.5% |
Demographics Similar to Yugoslavians by No Schooling Completed
In terms of no schooling completed, the demographic groups most similar to Yugoslavians are Immigrants from France (1.8%, a difference of 0.040%), Okinawan (1.8%, a difference of 0.22%), German Russian (1.8%, a difference of 0.44%), Thai (1.8%, a difference of 0.46%), and Immigrants from Saudi Arabia (1.9%, a difference of 0.57%).
| Demographics | Rating | Rank | No Schooling Completed |
| Immigrants | Singapore | 98.0 /100 | #100 | Exceptional 1.8% |
| Immigrants | Czechoslovakia | 97.9 /100 | #101 | Exceptional 1.8% |
| Immigrants | Switzerland | 97.9 /100 | #102 | Exceptional 1.8% |
| Basques | 97.9 /100 | #103 | Exceptional 1.8% |
| Thais | 97.5 /100 | #104 | Exceptional 1.8% |
| German Russians | 97.5 /100 | #105 | Exceptional 1.8% |
| Immigrants | France | 97.3 /100 | #106 | Exceptional 1.8% |
| Yugoslavians | 97.2 /100 | #107 | Exceptional 1.8% |
| Okinawans | 97.1 /100 | #108 | Exceptional 1.8% |
| Immigrants | Saudi Arabia | 96.8 /100 | #109 | Exceptional 1.9% |
| Immigrants | Latvia | 96.7 /100 | #110 | Exceptional 1.9% |
| Immigrants | Japan | 96.6 /100 | #111 | Exceptional 1.9% |
| Pueblo | 96.4 /100 | #112 | Exceptional 1.9% |
| Immigrants | Zimbabwe | 96.2 /100 | #113 | Exceptional 1.9% |
| Immigrants | Norway | 96.1 /100 | #114 | Exceptional 1.9% |