Assyrian/Chaldean/Syriac vs Tohono O'odham Disability Age 65 to 74
COMPARE
Assyrian/Chaldean/Syriac
Tohono O'odham
Disability Age 65 to 74
Disability Age 65 to 74 Comparison
Assyrians/Chaldeans/Syriacs
Tohono O'odham
23.4%
DISABILITY AGE 65 TO 74
45.3/ 100
METRIC RATING
181st/ 347
METRIC RANK
36.0%
DISABILITY AGE 65 TO 74
0.0/ 100
METRIC RATING
345th/ 347
METRIC RANK
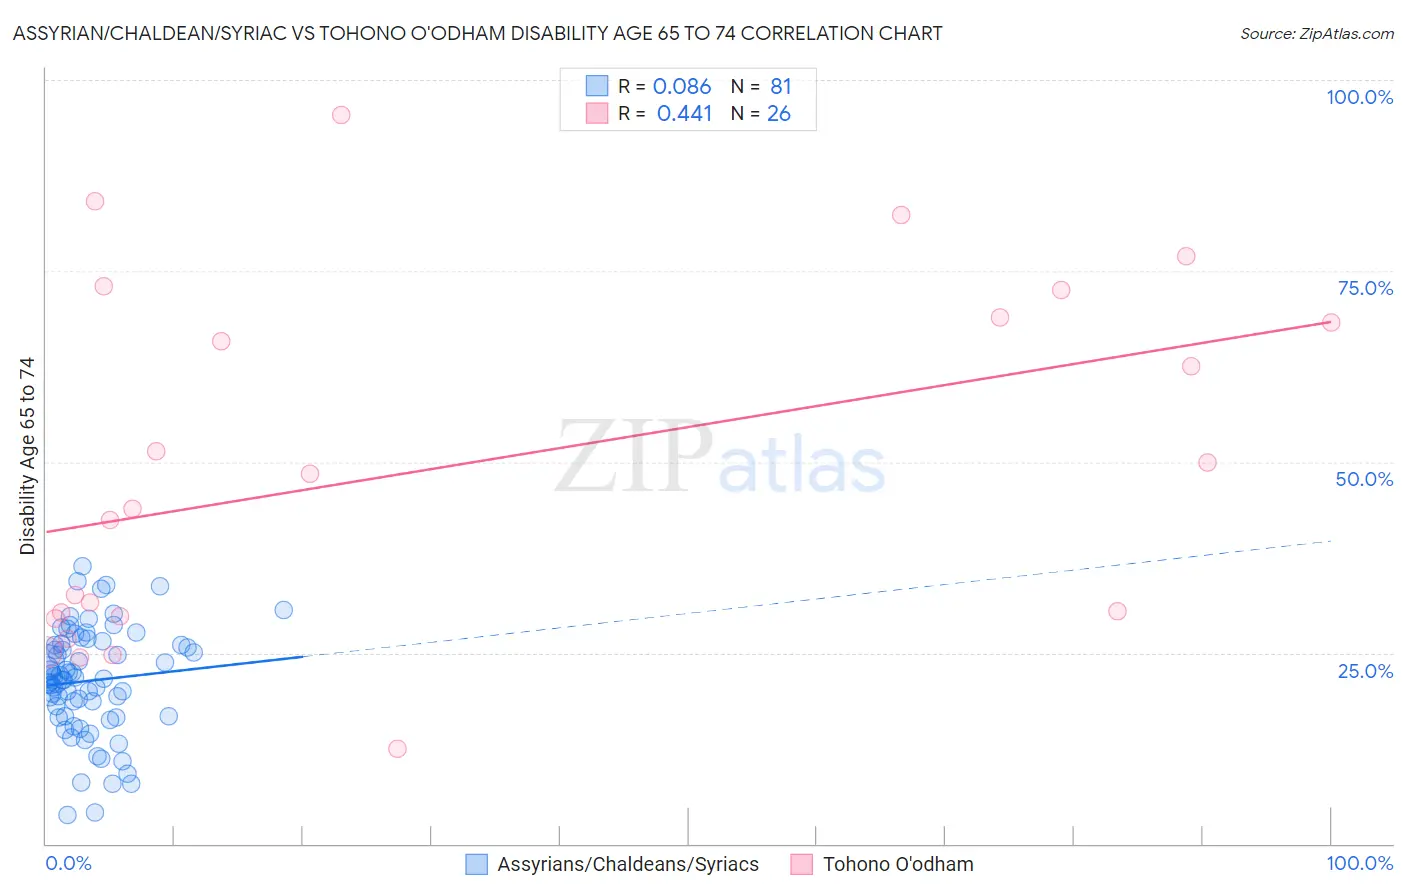
Assyrian/Chaldean/Syriac vs Tohono O'odham Disability Age 65 to 74 Correlation Chart
The statistical analysis conducted on geographies consisting of 110,230,384 people shows a slight positive correlation between the proportion of Assyrians/Chaldeans/Syriacs and percentage of population with a disability between the ages 65 and 75 in the United States with a correlation coefficient (R) of 0.086 and weighted average of 23.4%. Similarly, the statistical analysis conducted on geographies consisting of 58,691,657 people shows a moderate positive correlation between the proportion of Tohono O'odham and percentage of population with a disability between the ages 65 and 75 in the United States with a correlation coefficient (R) of 0.441 and weighted average of 36.0%, a difference of 54.0%.
Disability Age 65 to 74 Correlation Summary
| Measurement | Assyrian/Chaldean/Syriac | Tohono O'odham |
| Minimum | 3.8% | 12.4% |
| Maximum | 36.4% | 95.5% |
| Range | 32.6% | 83.1% |
| Mean | 21.3% | 49.4% |
| Median | 21.7% | 46.1% |
| Interquartile 25% (IQ1) | 16.7% | 29.8% |
| Interquartile 75% (IQ3) | 26.1% | 69.0% |
| Interquartile Range (IQR) | 9.4% | 39.1% |
| Standard Deviation (Sample) | 7.0% | 23.1% |
| Standard Deviation (Population) | 6.9% | 22.6% |
Similar Demographics by Disability Age 65 to 74
Demographics Similar to Assyrians/Chaldeans/Syriacs by Disability Age 65 to 74
In terms of disability age 65 to 74, the demographic groups most similar to Assyrians/Chaldeans/Syriacs are Scandinavian (23.4%, a difference of 0.010%), Guyanese (23.4%, a difference of 0.030%), Immigrants from Sierra Leone (23.4%, a difference of 0.030%), Irish (23.4%, a difference of 0.060%), and Immigrants from Eritrea (23.4%, a difference of 0.13%).
| Demographics | Rating | Rank | Disability Age 65 to 74 |
| Immigrants | South Eastern Asia | 50.0 /100 | #174 | Average 23.3% |
| Dutch | 49.4 /100 | #175 | Average 23.3% |
| Immigrants | Eritrea | 47.5 /100 | #176 | Average 23.4% |
| Immigrants | Haiti | 47.5 /100 | #177 | Average 23.4% |
| Guyanese | 45.8 /100 | #178 | Average 23.4% |
| Immigrants | Sierra Leone | 45.8 /100 | #179 | Average 23.4% |
| Scandinavians | 45.6 /100 | #180 | Average 23.4% |
| Assyrians/Chaldeans/Syriacs | 45.3 /100 | #181 | Average 23.4% |
| Irish | 44.4 /100 | #182 | Average 23.4% |
| Immigrants | Eastern Africa | 42.8 /100 | #183 | Average 23.4% |
| Immigrants | Germany | 42.5 /100 | #184 | Average 23.4% |
| Haitians | 42.4 /100 | #185 | Average 23.4% |
| Basques | 38.4 /100 | #186 | Fair 23.5% |
| Portuguese | 37.8 /100 | #187 | Fair 23.5% |
| Immigrants | Cuba | 34.0 /100 | #188 | Fair 23.6% |
Demographics Similar to Tohono O'odham by Disability Age 65 to 74
In terms of disability age 65 to 74, the demographic groups most similar to Tohono O'odham are Inupiat (34.5%, a difference of 4.3%), Yup'ik (37.8%, a difference of 5.0%), Pima (38.6%, a difference of 7.1%), Navajo (33.3%, a difference of 8.1%), and Pueblo (33.1%, a difference of 8.9%).
| Demographics | Rating | Rank | Disability Age 65 to 74 |
| Colville | 0.0 /100 | #333 | Tragic 30.5% |
| Alaska Natives | 0.0 /100 | #334 | Tragic 30.6% |
| Cheyenne | 0.0 /100 | #335 | Tragic 31.1% |
| Yuman | 0.0 /100 | #336 | Tragic 31.5% |
| Houma | 0.0 /100 | #337 | Tragic 32.3% |
| Alaskan Athabascans | 0.0 /100 | #338 | Tragic 32.4% |
| Kiowa | 0.0 /100 | #339 | Tragic 32.6% |
| Lumbee | 0.0 /100 | #340 | Tragic 32.7% |
| Tsimshian | 0.0 /100 | #341 | Tragic 32.9% |
| Pueblo | 0.0 /100 | #342 | Tragic 33.1% |
| Navajo | 0.0 /100 | #343 | Tragic 33.3% |
| Inupiat | 0.0 /100 | #344 | Tragic 34.5% |
| Tohono O'odham | 0.0 /100 | #345 | Tragic 36.0% |
| Yup'ik | 0.0 /100 | #346 | Tragic 37.8% |
| Pima | 0.0 /100 | #347 | Tragic 38.6% |