Assyrian/Chaldean/Syriac vs Alsatian Disability Age 65 to 74
COMPARE
Assyrian/Chaldean/Syriac
Alsatian
Disability Age 65 to 74
Disability Age 65 to 74 Comparison
Assyrians/Chaldeans/Syriacs
Alsatians
23.4%
DISABILITY AGE 65 TO 74
45.3/ 100
METRIC RATING
181st/ 347
METRIC RANK
22.8%
DISABILITY AGE 65 TO 74
83.7/ 100
METRIC RATING
146th/ 347
METRIC RANK
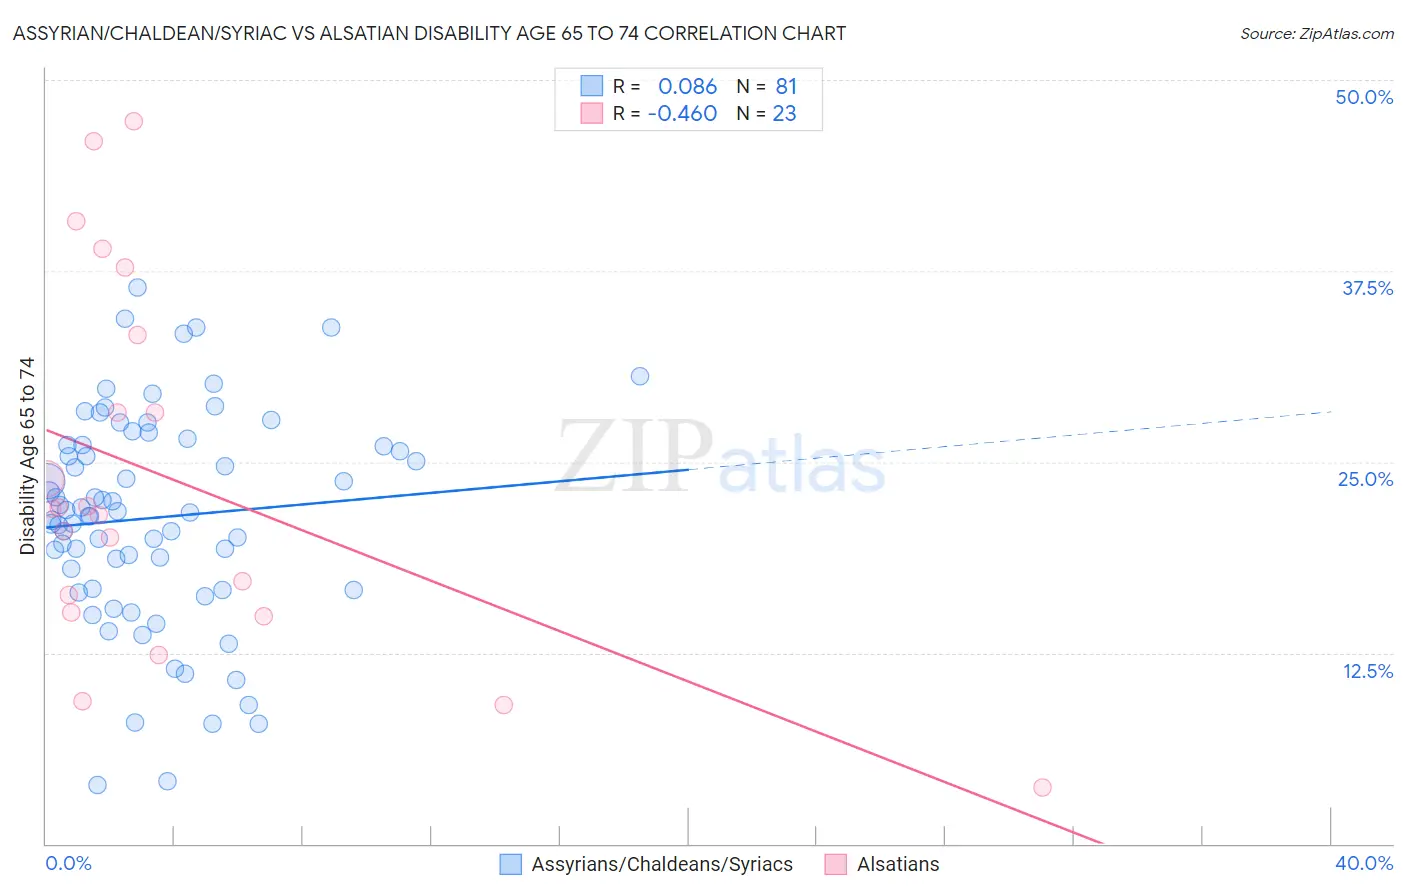
Assyrian/Chaldean/Syriac vs Alsatian Disability Age 65 to 74 Correlation Chart
The statistical analysis conducted on geographies consisting of 110,230,384 people shows a slight positive correlation between the proportion of Assyrians/Chaldeans/Syriacs and percentage of population with a disability between the ages 65 and 75 in the United States with a correlation coefficient (R) of 0.086 and weighted average of 23.4%. Similarly, the statistical analysis conducted on geographies consisting of 82,675,825 people shows a moderate negative correlation between the proportion of Alsatians and percentage of population with a disability between the ages 65 and 75 in the United States with a correlation coefficient (R) of -0.460 and weighted average of 22.8%, a difference of 2.7%.
Disability Age 65 to 74 Correlation Summary
| Measurement | Assyrian/Chaldean/Syriac | Alsatian |
| Minimum | 3.8% | 3.7% |
| Maximum | 36.4% | 47.3% |
| Range | 32.6% | 43.7% |
| Mean | 21.3% | 23.9% |
| Median | 21.7% | 22.0% |
| Interquartile 25% (IQ1) | 16.7% | 15.2% |
| Interquartile 75% (IQ3) | 26.1% | 33.3% |
| Interquartile Range (IQR) | 9.4% | 18.2% |
| Standard Deviation (Sample) | 7.0% | 12.0% |
| Standard Deviation (Population) | 6.9% | 11.7% |
Similar Demographics by Disability Age 65 to 74
Demographics Similar to Assyrians/Chaldeans/Syriacs by Disability Age 65 to 74
In terms of disability age 65 to 74, the demographic groups most similar to Assyrians/Chaldeans/Syriacs are Scandinavian (23.4%, a difference of 0.010%), Guyanese (23.4%, a difference of 0.030%), Immigrants from Sierra Leone (23.4%, a difference of 0.030%), Irish (23.4%, a difference of 0.060%), and Immigrants from Eritrea (23.4%, a difference of 0.13%).
| Demographics | Rating | Rank | Disability Age 65 to 74 |
| Immigrants | South Eastern Asia | 50.0 /100 | #174 | Average 23.3% |
| Dutch | 49.4 /100 | #175 | Average 23.3% |
| Immigrants | Eritrea | 47.5 /100 | #176 | Average 23.4% |
| Immigrants | Haiti | 47.5 /100 | #177 | Average 23.4% |
| Guyanese | 45.8 /100 | #178 | Average 23.4% |
| Immigrants | Sierra Leone | 45.8 /100 | #179 | Average 23.4% |
| Scandinavians | 45.6 /100 | #180 | Average 23.4% |
| Assyrians/Chaldeans/Syriacs | 45.3 /100 | #181 | Average 23.4% |
| Irish | 44.4 /100 | #182 | Average 23.4% |
| Immigrants | Eastern Africa | 42.8 /100 | #183 | Average 23.4% |
| Immigrants | Germany | 42.5 /100 | #184 | Average 23.4% |
| Haitians | 42.4 /100 | #185 | Average 23.4% |
| Basques | 38.4 /100 | #186 | Fair 23.5% |
| Portuguese | 37.8 /100 | #187 | Fair 23.5% |
| Immigrants | Cuba | 34.0 /100 | #188 | Fair 23.6% |
Demographics Similar to Alsatians by Disability Age 65 to 74
In terms of disability age 65 to 74, the demographic groups most similar to Alsatians are Immigrants from Uganda (22.8%, a difference of 0.030%), Danish (22.8%, a difference of 0.070%), Immigrants from Uzbekistan (22.8%, a difference of 0.070%), Arab (22.8%, a difference of 0.12%), and Immigrants from Ethiopia (22.7%, a difference of 0.18%).
| Demographics | Rating | Rank | Disability Age 65 to 74 |
| Immigrants | Syria | 85.8 /100 | #139 | Excellent 22.7% |
| Ugandans | 85.4 /100 | #140 | Excellent 22.7% |
| Belgians | 85.3 /100 | #141 | Excellent 22.7% |
| Immigrants | Ethiopia | 85.3 /100 | #142 | Excellent 22.7% |
| Arabs | 84.8 /100 | #143 | Excellent 22.8% |
| Danes | 84.4 /100 | #144 | Excellent 22.8% |
| Immigrants | Uganda | 84.0 /100 | #145 | Excellent 22.8% |
| Alsatians | 83.7 /100 | #146 | Excellent 22.8% |
| Immigrants | Uzbekistan | 83.1 /100 | #147 | Excellent 22.8% |
| New Zealanders | 79.9 /100 | #148 | Good 22.9% |
| Swiss | 79.7 /100 | #149 | Good 22.9% |
| Canadians | 77.7 /100 | #150 | Good 22.9% |
| Immigrants | Morocco | 77.6 /100 | #151 | Good 22.9% |
| Finns | 76.5 /100 | #152 | Good 22.9% |
| Slavs | 75.2 /100 | #153 | Good 23.0% |