Assyrian/Chaldean/Syriac vs Maltese Disability Age 65 to 74
COMPARE
Assyrian/Chaldean/Syriac
Maltese
Disability Age 65 to 74
Disability Age 65 to 74 Comparison
Assyrians/Chaldeans/Syriacs
Maltese
23.4%
DISABILITY AGE 65 TO 74
45.3/ 100
METRIC RATING
181st/ 347
METRIC RANK
21.6%
DISABILITY AGE 65 TO 74
99.4/ 100
METRIC RATING
66th/ 347
METRIC RANK
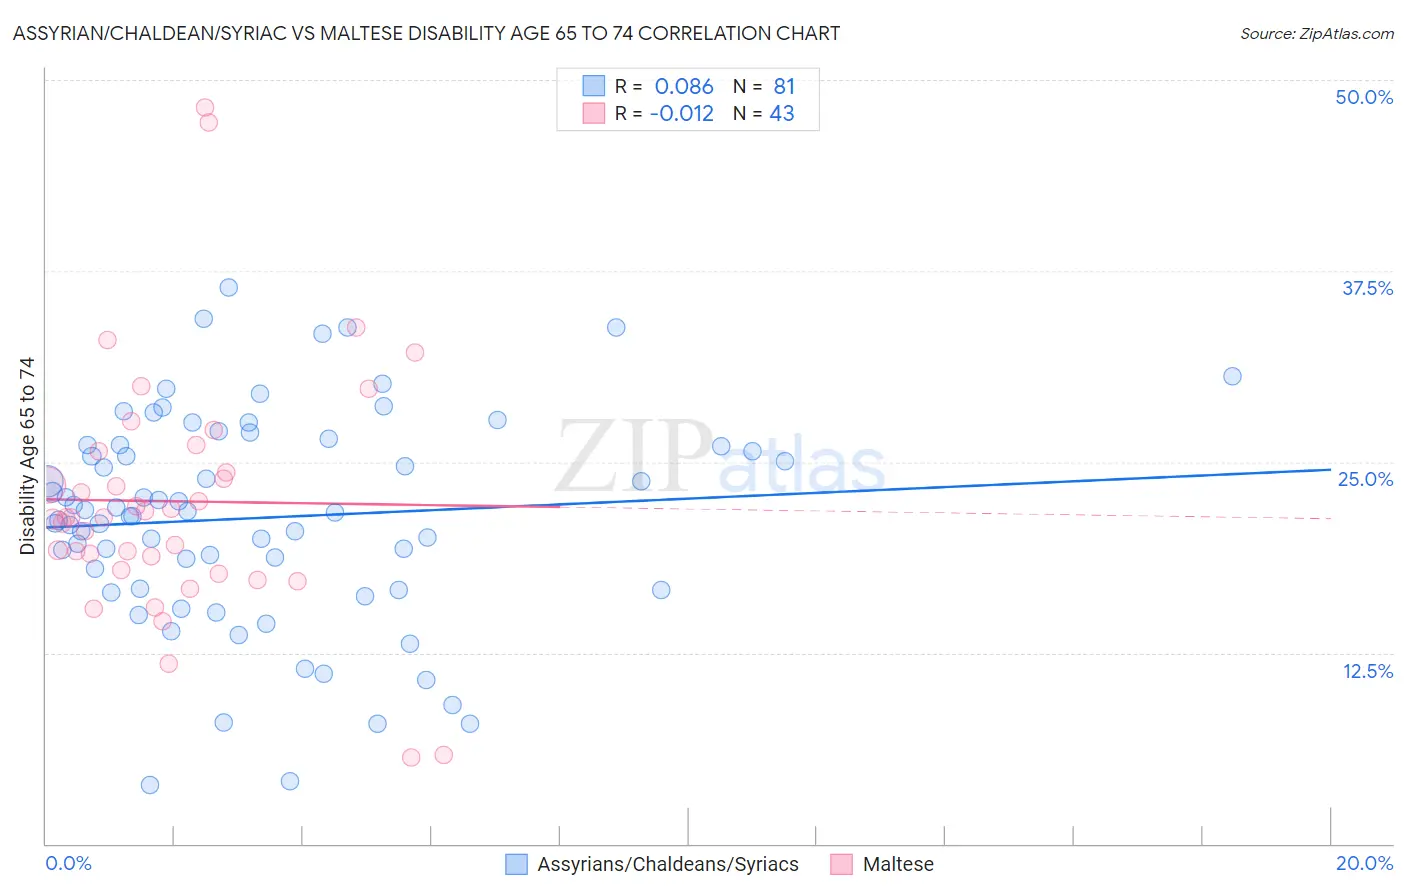
Assyrian/Chaldean/Syriac vs Maltese Disability Age 65 to 74 Correlation Chart
The statistical analysis conducted on geographies consisting of 110,230,384 people shows a slight positive correlation between the proportion of Assyrians/Chaldeans/Syriacs and percentage of population with a disability between the ages 65 and 75 in the United States with a correlation coefficient (R) of 0.086 and weighted average of 23.4%. Similarly, the statistical analysis conducted on geographies consisting of 126,377,352 people shows no correlation between the proportion of Maltese and percentage of population with a disability between the ages 65 and 75 in the United States with a correlation coefficient (R) of -0.012 and weighted average of 21.6%, a difference of 8.3%.
Disability Age 65 to 74 Correlation Summary
| Measurement | Assyrian/Chaldean/Syriac | Maltese |
| Minimum | 3.8% | 5.7% |
| Maximum | 36.4% | 48.2% |
| Range | 32.6% | 42.5% |
| Mean | 21.3% | 22.4% |
| Median | 21.7% | 21.4% |
| Interquartile 25% (IQ1) | 16.7% | 18.0% |
| Interquartile 75% (IQ3) | 26.1% | 25.7% |
| Interquartile Range (IQR) | 9.4% | 7.8% |
| Standard Deviation (Sample) | 7.0% | 8.2% |
| Standard Deviation (Population) | 6.9% | 8.1% |
Similar Demographics by Disability Age 65 to 74
Demographics Similar to Assyrians/Chaldeans/Syriacs by Disability Age 65 to 74
In terms of disability age 65 to 74, the demographic groups most similar to Assyrians/Chaldeans/Syriacs are Scandinavian (23.4%, a difference of 0.010%), Guyanese (23.4%, a difference of 0.030%), Immigrants from Sierra Leone (23.4%, a difference of 0.030%), Irish (23.4%, a difference of 0.060%), and Immigrants from Eritrea (23.4%, a difference of 0.13%).
| Demographics | Rating | Rank | Disability Age 65 to 74 |
| Immigrants | South Eastern Asia | 50.0 /100 | #174 | Average 23.3% |
| Dutch | 49.4 /100 | #175 | Average 23.3% |
| Immigrants | Eritrea | 47.5 /100 | #176 | Average 23.4% |
| Immigrants | Haiti | 47.5 /100 | #177 | Average 23.4% |
| Guyanese | 45.8 /100 | #178 | Average 23.4% |
| Immigrants | Sierra Leone | 45.8 /100 | #179 | Average 23.4% |
| Scandinavians | 45.6 /100 | #180 | Average 23.4% |
| Assyrians/Chaldeans/Syriacs | 45.3 /100 | #181 | Average 23.4% |
| Irish | 44.4 /100 | #182 | Average 23.4% |
| Immigrants | Eastern Africa | 42.8 /100 | #183 | Average 23.4% |
| Immigrants | Germany | 42.5 /100 | #184 | Average 23.4% |
| Haitians | 42.4 /100 | #185 | Average 23.4% |
| Basques | 38.4 /100 | #186 | Fair 23.5% |
| Portuguese | 37.8 /100 | #187 | Fair 23.5% |
| Immigrants | Cuba | 34.0 /100 | #188 | Fair 23.6% |
Demographics Similar to Maltese by Disability Age 65 to 74
In terms of disability age 65 to 74, the demographic groups most similar to Maltese are Immigrants from Russia (21.6%, a difference of 0.010%), Immigrants from Latvia (21.6%, a difference of 0.030%), Immigrants from Europe (21.6%, a difference of 0.11%), Carpatho Rusyn (21.6%, a difference of 0.20%), and Immigrants from South Africa (21.7%, a difference of 0.20%).
| Demographics | Rating | Rank | Disability Age 65 to 74 |
| Zimbabweans | 99.5 /100 | #59 | Exceptional 21.5% |
| Immigrants | North Macedonia | 99.5 /100 | #60 | Exceptional 21.6% |
| Egyptians | 99.5 /100 | #61 | Exceptional 21.6% |
| Carpatho Rusyns | 99.5 /100 | #62 | Exceptional 21.6% |
| Immigrants | Europe | 99.4 /100 | #63 | Exceptional 21.6% |
| Immigrants | Latvia | 99.4 /100 | #64 | Exceptional 21.6% |
| Immigrants | Russia | 99.4 /100 | #65 | Exceptional 21.6% |
| Maltese | 99.4 /100 | #66 | Exceptional 21.6% |
| Immigrants | South Africa | 99.3 /100 | #67 | Exceptional 21.7% |
| Immigrants | Scotland | 99.3 /100 | #68 | Exceptional 21.7% |
| Immigrants | Egypt | 99.2 /100 | #69 | Exceptional 21.7% |
| Chinese | 99.2 /100 | #70 | Exceptional 21.7% |
| Immigrants | Belarus | 99.2 /100 | #71 | Exceptional 21.7% |
| Immigrants | Hungary | 99.2 /100 | #72 | Exceptional 21.7% |
| Immigrants | Venezuela | 99.0 /100 | #73 | Exceptional 21.8% |