Assyrian/Chaldean/Syriac vs Thai Disability Age 65 to 74
COMPARE
Assyrian/Chaldean/Syriac
Thai
Disability Age 65 to 74
Disability Age 65 to 74 Comparison
Assyrians/Chaldeans/Syriacs
Thais
23.4%
DISABILITY AGE 65 TO 74
45.3/ 100
METRIC RATING
181st/ 347
METRIC RANK
20.1%
DISABILITY AGE 65 TO 74
100.0/ 100
METRIC RATING
8th/ 347
METRIC RANK
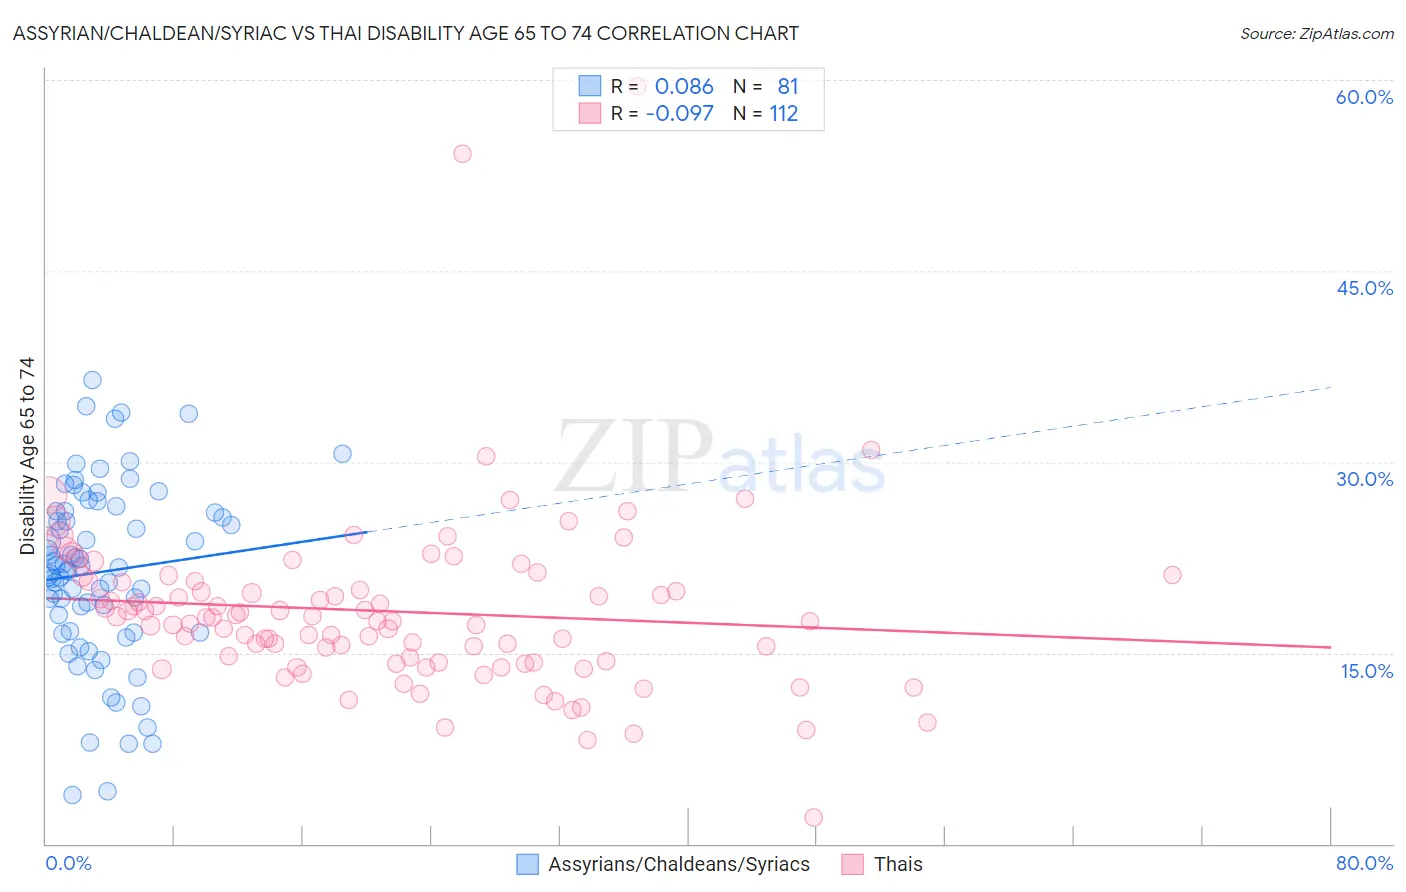
Assyrian/Chaldean/Syriac vs Thai Disability Age 65 to 74 Correlation Chart
The statistical analysis conducted on geographies consisting of 110,230,384 people shows a slight positive correlation between the proportion of Assyrians/Chaldeans/Syriacs and percentage of population with a disability between the ages 65 and 75 in the United States with a correlation coefficient (R) of 0.086 and weighted average of 23.4%. Similarly, the statistical analysis conducted on geographies consisting of 474,585,804 people shows a slight negative correlation between the proportion of Thais and percentage of population with a disability between the ages 65 and 75 in the United States with a correlation coefficient (R) of -0.097 and weighted average of 20.1%, a difference of 16.6%.
Disability Age 65 to 74 Correlation Summary
| Measurement | Assyrian/Chaldean/Syriac | Thai |
| Minimum | 3.8% | 2.1% |
| Maximum | 36.4% | 59.5% |
| Range | 32.6% | 57.4% |
| Mean | 21.3% | 18.3% |
| Median | 21.7% | 17.6% |
| Interquartile 25% (IQ1) | 16.7% | 14.3% |
| Interquartile 75% (IQ3) | 26.1% | 20.6% |
| Interquartile Range (IQR) | 9.4% | 6.3% |
| Standard Deviation (Sample) | 7.0% | 7.1% |
| Standard Deviation (Population) | 6.9% | 7.1% |
Similar Demographics by Disability Age 65 to 74
Demographics Similar to Assyrians/Chaldeans/Syriacs by Disability Age 65 to 74
In terms of disability age 65 to 74, the demographic groups most similar to Assyrians/Chaldeans/Syriacs are Scandinavian (23.4%, a difference of 0.010%), Guyanese (23.4%, a difference of 0.030%), Immigrants from Sierra Leone (23.4%, a difference of 0.030%), Irish (23.4%, a difference of 0.060%), and Immigrants from Eritrea (23.4%, a difference of 0.13%).
| Demographics | Rating | Rank | Disability Age 65 to 74 |
| Immigrants | South Eastern Asia | 50.0 /100 | #174 | Average 23.3% |
| Dutch | 49.4 /100 | #175 | Average 23.3% |
| Immigrants | Eritrea | 47.5 /100 | #176 | Average 23.4% |
| Immigrants | Haiti | 47.5 /100 | #177 | Average 23.4% |
| Guyanese | 45.8 /100 | #178 | Average 23.4% |
| Immigrants | Sierra Leone | 45.8 /100 | #179 | Average 23.4% |
| Scandinavians | 45.6 /100 | #180 | Average 23.4% |
| Assyrians/Chaldeans/Syriacs | 45.3 /100 | #181 | Average 23.4% |
| Irish | 44.4 /100 | #182 | Average 23.4% |
| Immigrants | Eastern Africa | 42.8 /100 | #183 | Average 23.4% |
| Immigrants | Germany | 42.5 /100 | #184 | Average 23.4% |
| Haitians | 42.4 /100 | #185 | Average 23.4% |
| Basques | 38.4 /100 | #186 | Fair 23.5% |
| Portuguese | 37.8 /100 | #187 | Fair 23.5% |
| Immigrants | Cuba | 34.0 /100 | #188 | Fair 23.6% |
Demographics Similar to Thais by Disability Age 65 to 74
In terms of disability age 65 to 74, the demographic groups most similar to Thais are Cypriot (20.1%, a difference of 0.040%), Iranian (19.9%, a difference of 0.70%), Immigrants from Israel (19.9%, a difference of 0.82%), Immigrants from China (20.3%, a difference of 0.96%), and Immigrants from Eastern Asia (20.3%, a difference of 1.0%).
| Demographics | Rating | Rank | Disability Age 65 to 74 |
| Immigrants | Taiwan | 100.0 /100 | #1 | Exceptional 18.8% |
| Filipinos | 100.0 /100 | #2 | Exceptional 19.0% |
| Immigrants | India | 100.0 /100 | #3 | Exceptional 19.7% |
| Immigrants | Hong Kong | 100.0 /100 | #4 | Exceptional 19.9% |
| Immigrants | Israel | 100.0 /100 | #5 | Exceptional 19.9% |
| Iranians | 100.0 /100 | #6 | Exceptional 19.9% |
| Cypriots | 100.0 /100 | #7 | Exceptional 20.1% |
| Thais | 100.0 /100 | #8 | Exceptional 20.1% |
| Immigrants | China | 100.0 /100 | #9 | Exceptional 20.3% |
| Immigrants | Eastern Asia | 100.0 /100 | #10 | Exceptional 20.3% |
| Immigrants | Ireland | 100.0 /100 | #11 | Exceptional 20.3% |
| Immigrants | Korea | 100.0 /100 | #12 | Exceptional 20.4% |
| Immigrants | Singapore | 100.0 /100 | #13 | Exceptional 20.4% |
| Indians (Asian) | 100.0 /100 | #14 | Exceptional 20.5% |
| Paraguayans | 100.0 /100 | #15 | Exceptional 20.5% |