Assyrian/Chaldean/Syriac vs Immigrants from Guatemala Hearing Disability
COMPARE
Assyrian/Chaldean/Syriac
Immigrants from Guatemala
Hearing Disability
Hearing Disability Comparison
Assyrians/Chaldeans/Syriacs
Immigrants from Guatemala
3.3%
HEARING DISABILITY
0.9/ 100
METRIC RATING
244th/ 347
METRIC RANK
2.8%
HEARING DISABILITY
95.1/ 100
METRIC RATING
99th/ 347
METRIC RANK
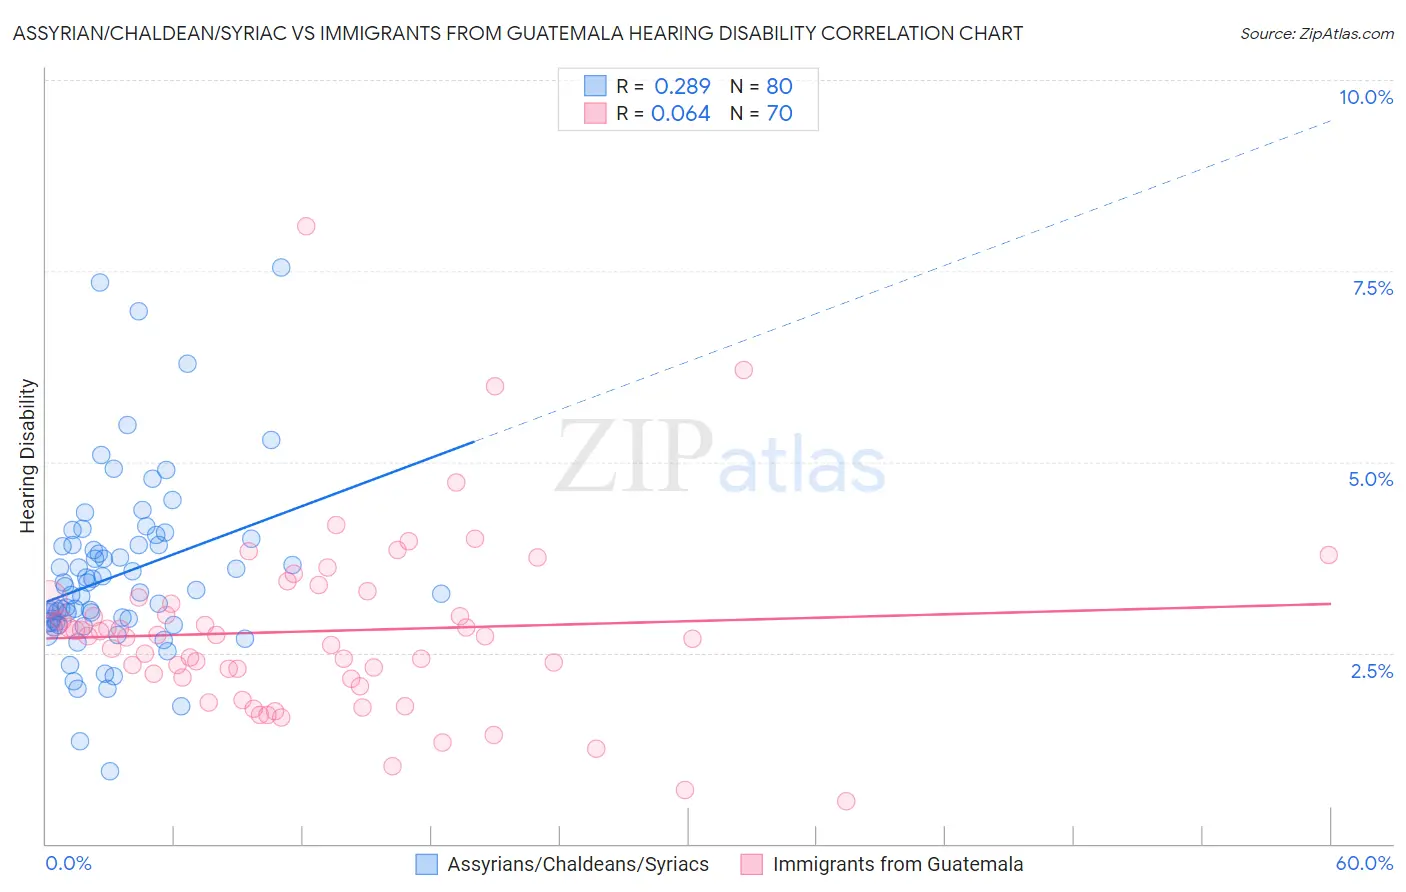
Assyrian/Chaldean/Syriac vs Immigrants from Guatemala Hearing Disability Correlation Chart
The statistical analysis conducted on geographies consisting of 110,312,508 people shows a weak positive correlation between the proportion of Assyrians/Chaldeans/Syriacs and percentage of population with hearing disability in the United States with a correlation coefficient (R) of 0.289 and weighted average of 3.3%. Similarly, the statistical analysis conducted on geographies consisting of 377,187,532 people shows a slight positive correlation between the proportion of Immigrants from Guatemala and percentage of population with hearing disability in the United States with a correlation coefficient (R) of 0.064 and weighted average of 2.8%, a difference of 19.3%.
Hearing Disability Correlation Summary
| Measurement | Assyrian/Chaldean/Syriac | Immigrants from Guatemala |
| Minimum | 0.96% | 0.55% |
| Maximum | 7.5% | 8.1% |
| Range | 6.6% | 7.5% |
| Mean | 3.5% | 2.8% |
| Median | 3.3% | 2.7% |
| Interquartile 25% (IQ1) | 2.9% | 2.2% |
| Interquartile 75% (IQ3) | 3.9% | 3.2% |
| Interquartile Range (IQR) | 1.0% | 1.0% |
| Standard Deviation (Sample) | 1.2% | 1.2% |
| Standard Deviation (Population) | 1.2% | 1.2% |
Similar Demographics by Hearing Disability
Demographics Similar to Assyrians/Chaldeans/Syriacs by Hearing Disability
In terms of hearing disability, the demographic groups most similar to Assyrians/Chaldeans/Syriacs are Immigrants from Western Europe (3.3%, a difference of 0.070%), Yugoslavian (3.3%, a difference of 0.24%), Immigrants from Scotland (3.3%, a difference of 0.34%), Samoan (3.3%, a difference of 0.35%), and Immigrants from Netherlands (3.3%, a difference of 0.43%).
| Demographics | Rating | Rank | Hearing Disability |
| Immigrants | Austria | 1.8 /100 | #237 | Tragic 3.3% |
| German Russians | 1.8 /100 | #238 | Tragic 3.3% |
| Nepalese | 1.2 /100 | #239 | Tragic 3.3% |
| Immigrants | Netherlands | 1.1 /100 | #240 | Tragic 3.3% |
| Samoans | 1.1 /100 | #241 | Tragic 3.3% |
| Yugoslavians | 1.0 /100 | #242 | Tragic 3.3% |
| Immigrants | Western Europe | 1.0 /100 | #243 | Tragic 3.3% |
| Assyrians/Chaldeans/Syriacs | 0.9 /100 | #244 | Tragic 3.3% |
| Immigrants | Scotland | 0.8 /100 | #245 | Tragic 3.3% |
| Immigrants | England | 0.7 /100 | #246 | Tragic 3.3% |
| Lithuanians | 0.6 /100 | #247 | Tragic 3.4% |
| Austrians | 0.6 /100 | #248 | Tragic 3.4% |
| Italians | 0.4 /100 | #249 | Tragic 3.4% |
| Yuman | 0.4 /100 | #250 | Tragic 3.4% |
| Hungarians | 0.4 /100 | #251 | Tragic 3.4% |
Demographics Similar to Immigrants from Guatemala by Hearing Disability
In terms of hearing disability, the demographic groups most similar to Immigrants from Guatemala are Immigrants from Honduras (2.8%, a difference of 0.040%), Immigrants from Eastern Africa (2.8%, a difference of 0.050%), Immigrants from Afghanistan (2.8%, a difference of 0.10%), Immigrants from Spain (2.8%, a difference of 0.11%), and Taiwanese (2.8%, a difference of 0.12%).
| Demographics | Rating | Rank | Hearing Disability |
| Iranians | 96.4 /100 | #92 | Exceptional 2.8% |
| Immigrants | Kuwait | 96.3 /100 | #93 | Exceptional 2.8% |
| Uruguayans | 95.9 /100 | #94 | Exceptional 2.8% |
| Israelis | 95.9 /100 | #95 | Exceptional 2.8% |
| Immigrants | Somalia | 95.5 /100 | #96 | Exceptional 2.8% |
| Immigrants | Afghanistan | 95.3 /100 | #97 | Exceptional 2.8% |
| Immigrants | Honduras | 95.1 /100 | #98 | Exceptional 2.8% |
| Immigrants | Guatemala | 95.1 /100 | #99 | Exceptional 2.8% |
| Immigrants | Eastern Africa | 95.0 /100 | #100 | Exceptional 2.8% |
| Immigrants | Spain | 94.9 /100 | #101 | Exceptional 2.8% |
| Taiwanese | 94.8 /100 | #102 | Exceptional 2.8% |
| Immigrants | Indonesia | 94.7 /100 | #103 | Exceptional 2.8% |
| Burmese | 94.2 /100 | #104 | Exceptional 2.8% |
| Moroccans | 93.9 /100 | #105 | Exceptional 2.8% |
| Hondurans | 93.4 /100 | #106 | Exceptional 2.8% |