Assyrian/Chaldean/Syriac vs Immigrants from Lebanon Hearing Disability
COMPARE
Assyrian/Chaldean/Syriac
Immigrants from Lebanon
Hearing Disability
Hearing Disability Comparison
Assyrians/Chaldeans/Syriacs
Immigrants from Lebanon
3.3%
HEARING DISABILITY
0.9/ 100
METRIC RATING
244th/ 347
METRIC RANK
2.9%
HEARING DISABILITY
71.5/ 100
METRIC RATING
154th/ 347
METRIC RANK
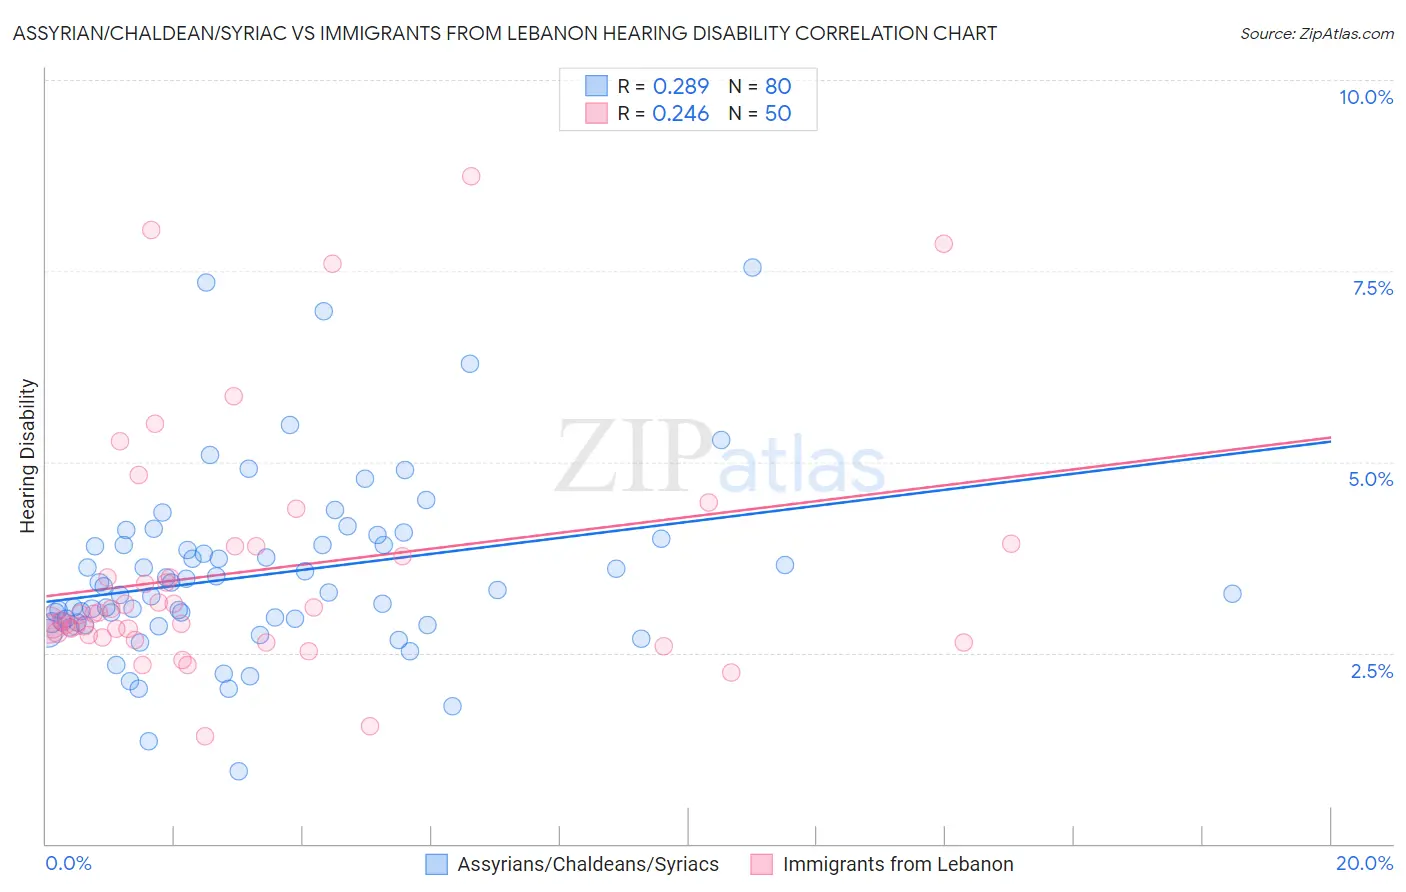
Assyrian/Chaldean/Syriac vs Immigrants from Lebanon Hearing Disability Correlation Chart
The statistical analysis conducted on geographies consisting of 110,312,508 people shows a weak positive correlation between the proportion of Assyrians/Chaldeans/Syriacs and percentage of population with hearing disability in the United States with a correlation coefficient (R) of 0.289 and weighted average of 3.3%. Similarly, the statistical analysis conducted on geographies consisting of 217,145,766 people shows a weak positive correlation between the proportion of Immigrants from Lebanon and percentage of population with hearing disability in the United States with a correlation coefficient (R) of 0.246 and weighted average of 2.9%, a difference of 13.4%.
Hearing Disability Correlation Summary
| Measurement | Assyrian/Chaldean/Syriac | Immigrants from Lebanon |
| Minimum | 0.96% | 1.4% |
| Maximum | 7.5% | 8.7% |
| Range | 6.6% | 7.3% |
| Mean | 3.5% | 3.6% |
| Median | 3.3% | 3.0% |
| Interquartile 25% (IQ1) | 2.9% | 2.7% |
| Interquartile 75% (IQ3) | 3.9% | 3.9% |
| Interquartile Range (IQR) | 1.0% | 1.2% |
| Standard Deviation (Sample) | 1.2% | 1.6% |
| Standard Deviation (Population) | 1.2% | 1.6% |
Similar Demographics by Hearing Disability
Demographics Similar to Assyrians/Chaldeans/Syriacs by Hearing Disability
In terms of hearing disability, the demographic groups most similar to Assyrians/Chaldeans/Syriacs are Immigrants from Western Europe (3.3%, a difference of 0.070%), Yugoslavian (3.3%, a difference of 0.24%), Immigrants from Scotland (3.3%, a difference of 0.34%), Samoan (3.3%, a difference of 0.35%), and Immigrants from Netherlands (3.3%, a difference of 0.43%).
| Demographics | Rating | Rank | Hearing Disability |
| Immigrants | Austria | 1.8 /100 | #237 | Tragic 3.3% |
| German Russians | 1.8 /100 | #238 | Tragic 3.3% |
| Nepalese | 1.2 /100 | #239 | Tragic 3.3% |
| Immigrants | Netherlands | 1.1 /100 | #240 | Tragic 3.3% |
| Samoans | 1.1 /100 | #241 | Tragic 3.3% |
| Yugoslavians | 1.0 /100 | #242 | Tragic 3.3% |
| Immigrants | Western Europe | 1.0 /100 | #243 | Tragic 3.3% |
| Assyrians/Chaldeans/Syriacs | 0.9 /100 | #244 | Tragic 3.3% |
| Immigrants | Scotland | 0.8 /100 | #245 | Tragic 3.3% |
| Immigrants | England | 0.7 /100 | #246 | Tragic 3.3% |
| Lithuanians | 0.6 /100 | #247 | Tragic 3.4% |
| Austrians | 0.6 /100 | #248 | Tragic 3.4% |
| Italians | 0.4 /100 | #249 | Tragic 3.4% |
| Yuman | 0.4 /100 | #250 | Tragic 3.4% |
| Hungarians | 0.4 /100 | #251 | Tragic 3.4% |
Demographics Similar to Immigrants from Lebanon by Hearing Disability
In terms of hearing disability, the demographic groups most similar to Immigrants from Lebanon are Costa Rican (2.9%, a difference of 0.010%), Sudanese (2.9%, a difference of 0.070%), Immigrants from Poland (2.9%, a difference of 0.15%), Immigrants from Lithuania (2.9%, a difference of 0.18%), and Immigrants from France (2.9%, a difference of 0.19%).
| Demographics | Rating | Rank | Hearing Disability |
| Tongans | 78.6 /100 | #147 | Good 2.9% |
| Immigrants | Russia | 77.7 /100 | #148 | Good 2.9% |
| Immigrants | Panama | 76.9 /100 | #149 | Good 2.9% |
| Palestinians | 73.6 /100 | #150 | Good 2.9% |
| Immigrants | France | 73.1 /100 | #151 | Good 2.9% |
| Immigrants | Lithuania | 73.0 /100 | #152 | Good 2.9% |
| Sudanese | 72.1 /100 | #153 | Good 2.9% |
| Immigrants | Lebanon | 71.5 /100 | #154 | Good 2.9% |
| Costa Ricans | 71.4 /100 | #155 | Good 2.9% |
| Immigrants | Poland | 70.2 /100 | #156 | Good 2.9% |
| Immigrants | Kazakhstan | 69.6 /100 | #157 | Good 2.9% |
| Immigrants | Burma/Myanmar | 69.5 /100 | #158 | Good 2.9% |
| Immigrants | Australia | 67.4 /100 | #159 | Good 2.9% |
| Immigrants | Fiji | 67.1 /100 | #160 | Good 2.9% |
| Albanians | 66.6 /100 | #161 | Good 2.9% |