Houma vs Immigrants from Cameroon Male Disability
COMPARE
Houma
Immigrants from Cameroon
Male Disability
Male Disability Comparison
Houma
Immigrants from Cameroon
17.4%
MALE DISABILITY
0.0/ 100
METRIC RATING
347th/ 347
METRIC RANK
10.5%
MALE DISABILITY
99.0/ 100
METRIC RATING
71st/ 347
METRIC RANK
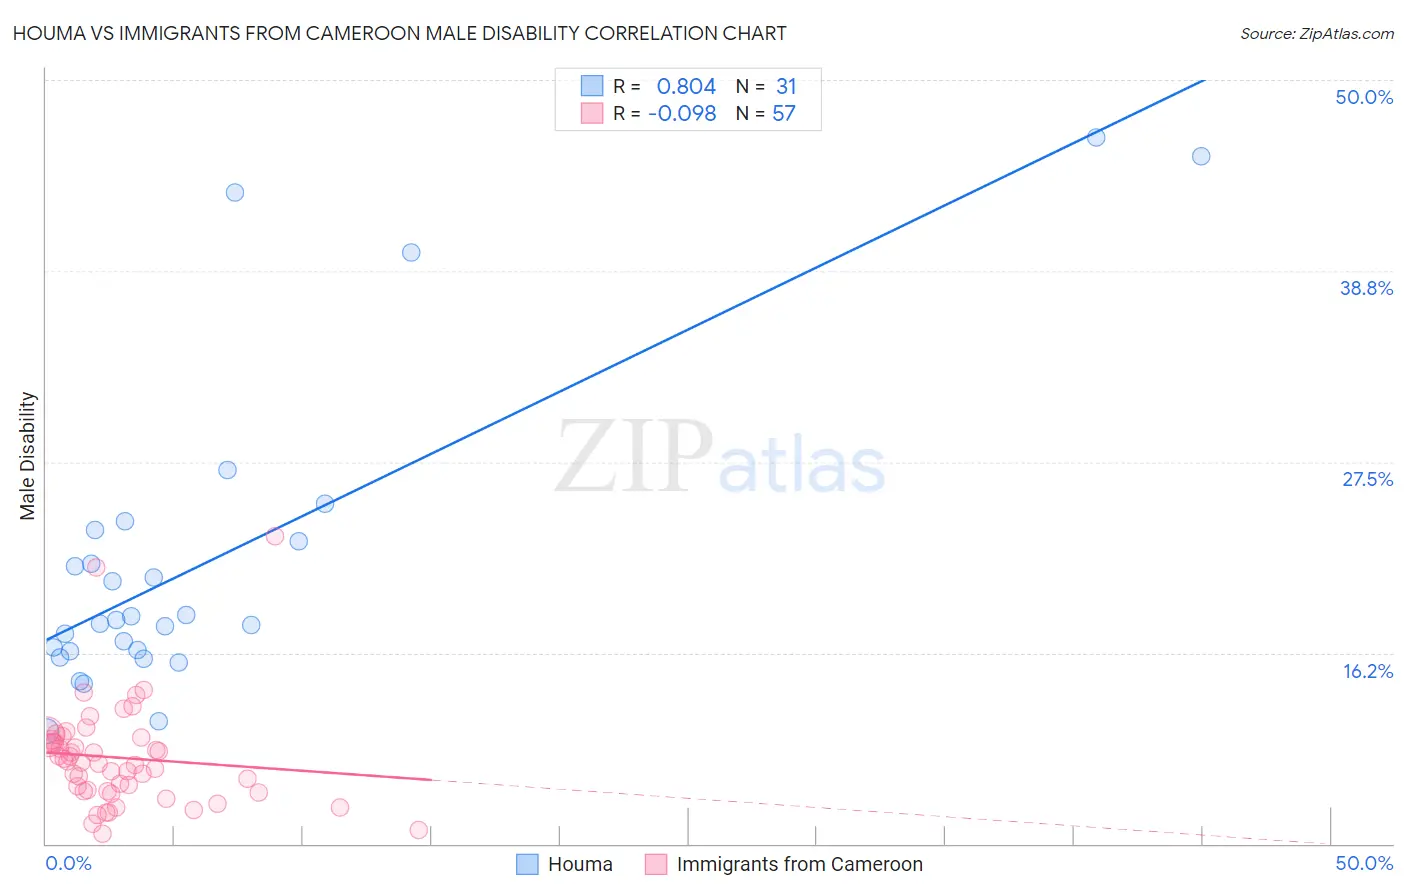
Houma vs Immigrants from Cameroon Male Disability Correlation Chart
The statistical analysis conducted on geographies consisting of 36,793,255 people shows a very strong positive correlation between the proportion of Houma and percentage of males with a disability in the United States with a correlation coefficient (R) of 0.804 and weighted average of 17.4%. Similarly, the statistical analysis conducted on geographies consisting of 130,760,441 people shows a slight negative correlation between the proportion of Immigrants from Cameroon and percentage of males with a disability in the United States with a correlation coefficient (R) of -0.098 and weighted average of 10.5%, a difference of 66.0%.
Male Disability Correlation Summary
| Measurement | Houma | Immigrants from Cameroon |
| Minimum | 11.6% | 5.6% |
| Maximum | 46.6% | 23.1% |
| Range | 35.0% | 17.6% |
| Mean | 21.8% | 10.1% |
| Median | 18.2% | 9.8% |
| Interquartile 25% (IQ1) | 16.4% | 8.1% |
| Interquartile 75% (IQ3) | 23.5% | 11.2% |
| Interquartile Range (IQR) | 7.1% | 3.1% |
| Standard Deviation (Sample) | 9.4% | 3.1% |
| Standard Deviation (Population) | 9.2% | 3.1% |
Similar Demographics by Male Disability
Demographics Similar to Houma by Male Disability
In terms of male disability, the demographic groups most similar to Houma are Colville (16.5%, a difference of 5.7%), Tsimshian (15.6%, a difference of 11.8%), Puerto Rican (15.6%, a difference of 12.1%), Creek (15.5%, a difference of 12.3%), and Kiowa (15.4%, a difference of 13.0%).
| Demographics | Rating | Rank | Male Disability |
| Yuman | 0.0 /100 | #333 | Tragic 14.7% |
| Cherokee | 0.0 /100 | #334 | Tragic 14.8% |
| Dutch West Indians | 0.0 /100 | #335 | Tragic 14.8% |
| Alaskan Athabascans | 0.0 /100 | #336 | Tragic 14.9% |
| Menominee | 0.0 /100 | #337 | Tragic 15.0% |
| Pueblo | 0.0 /100 | #338 | Tragic 15.0% |
| Chickasaw | 0.0 /100 | #339 | Tragic 15.1% |
| Lumbee | 0.0 /100 | #340 | Tragic 15.2% |
| Choctaw | 0.0 /100 | #341 | Tragic 15.4% |
| Kiowa | 0.0 /100 | #342 | Tragic 15.4% |
| Creek | 0.0 /100 | #343 | Tragic 15.5% |
| Puerto Ricans | 0.0 /100 | #344 | Tragic 15.6% |
| Tsimshian | 0.0 /100 | #345 | Tragic 15.6% |
| Colville | 0.0 /100 | #346 | Tragic 16.5% |
| Houma | 0.0 /100 | #347 | Tragic 17.4% |
Demographics Similar to Immigrants from Cameroon by Male Disability
In terms of male disability, the demographic groups most similar to Immigrants from Cameroon are Immigrants from Serbia (10.5%, a difference of 0.060%), Immigrants from Lithuania (10.5%, a difference of 0.12%), Immigrants from Bulgaria (10.5%, a difference of 0.15%), Immigrants from Lebanon (10.5%, a difference of 0.26%), and Colombian (10.5%, a difference of 0.29%).
| Demographics | Rating | Rank | Male Disability |
| Jordanians | 99.3 /100 | #64 | Exceptional 10.5% |
| Immigrants | Grenada | 99.2 /100 | #65 | Exceptional 10.5% |
| Guyanese | 99.2 /100 | #66 | Exceptional 10.5% |
| Immigrants | Afghanistan | 99.2 /100 | #67 | Exceptional 10.5% |
| Colombians | 99.2 /100 | #68 | Exceptional 10.5% |
| Ecuadorians | 99.2 /100 | #69 | Exceptional 10.5% |
| Immigrants | Bulgaria | 99.1 /100 | #70 | Exceptional 10.5% |
| Immigrants | Cameroon | 99.0 /100 | #71 | Exceptional 10.5% |
| Immigrants | Serbia | 99.0 /100 | #72 | Exceptional 10.5% |
| Immigrants | Lithuania | 98.9 /100 | #73 | Exceptional 10.5% |
| Immigrants | Lebanon | 98.8 /100 | #74 | Exceptional 10.5% |
| Sierra Leoneans | 98.7 /100 | #75 | Exceptional 10.5% |
| Immigrants | Sierra Leone | 98.7 /100 | #76 | Exceptional 10.5% |
| Laotians | 98.6 /100 | #77 | Exceptional 10.6% |
| Immigrants | Russia | 98.6 /100 | #78 | Exceptional 10.6% |