Maltese vs Immigrants from Cameroon Male Disability
COMPARE
Maltese
Immigrants from Cameroon
Male Disability
Male Disability Comparison
Maltese
Immigrants from Cameroon
11.2%
MALE DISABILITY
50.0/ 100
METRIC RATING
174th/ 347
METRIC RANK
10.5%
MALE DISABILITY
99.0/ 100
METRIC RATING
71st/ 347
METRIC RANK
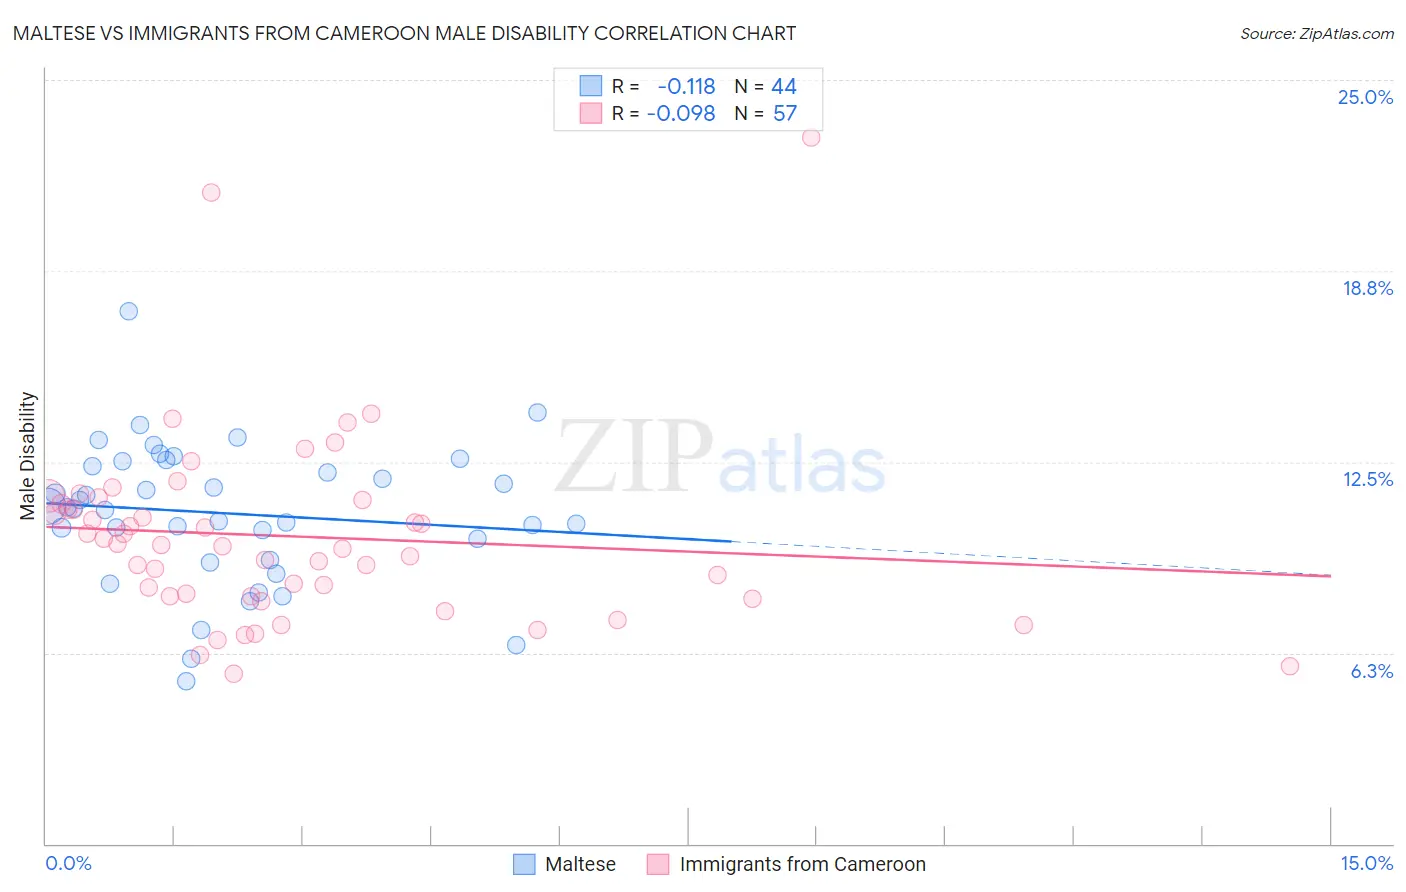
Maltese vs Immigrants from Cameroon Male Disability Correlation Chart
The statistical analysis conducted on geographies consisting of 126,476,999 people shows a poor negative correlation between the proportion of Maltese and percentage of males with a disability in the United States with a correlation coefficient (R) of -0.118 and weighted average of 11.2%. Similarly, the statistical analysis conducted on geographies consisting of 130,760,441 people shows a slight negative correlation between the proportion of Immigrants from Cameroon and percentage of males with a disability in the United States with a correlation coefficient (R) of -0.098 and weighted average of 10.5%, a difference of 6.8%.
Male Disability Correlation Summary
| Measurement | Maltese | Immigrants from Cameroon |
| Minimum | 5.3% | 5.6% |
| Maximum | 17.4% | 23.1% |
| Range | 12.1% | 17.6% |
| Mean | 10.8% | 10.1% |
| Median | 11.0% | 9.8% |
| Interquartile 25% (IQ1) | 9.6% | 8.1% |
| Interquartile 75% (IQ3) | 12.4% | 11.2% |
| Interquartile Range (IQR) | 2.8% | 3.1% |
| Standard Deviation (Sample) | 2.3% | 3.1% |
| Standard Deviation (Population) | 2.3% | 3.1% |
Similar Demographics by Male Disability
Demographics Similar to Maltese by Male Disability
In terms of male disability, the demographic groups most similar to Maltese are Immigrants from Burma/Myanmar (11.2%, a difference of 0.020%), Romanian (11.2%, a difference of 0.040%), Immigrants from Honduras (11.2%, a difference of 0.070%), Haitian (11.2%, a difference of 0.14%), and New Zealander (11.2%, a difference of 0.16%).
| Demographics | Rating | Rank | Male Disability |
| Immigrants | Southern Europe | 54.4 /100 | #167 | Average 11.2% |
| Immigrants | Latin America | 54.0 /100 | #168 | Average 11.2% |
| Barbadians | 53.4 /100 | #169 | Average 11.2% |
| New Zealanders | 52.9 /100 | #170 | Average 11.2% |
| Haitians | 52.5 /100 | #171 | Average 11.2% |
| Romanians | 50.7 /100 | #172 | Average 11.2% |
| Immigrants | Burma/Myanmar | 50.4 /100 | #173 | Average 11.2% |
| Maltese | 50.0 /100 | #174 | Average 11.2% |
| Immigrants | Honduras | 48.7 /100 | #175 | Average 11.2% |
| Syrians | 46.6 /100 | #176 | Average 11.2% |
| Immigrants | Norway | 44.2 /100 | #177 | Average 11.3% |
| Australians | 42.2 /100 | #178 | Average 11.3% |
| Immigrants | Caribbean | 41.4 /100 | #179 | Average 11.3% |
| Hondurans | 41.1 /100 | #180 | Average 11.3% |
| Immigrants | Senegal | 34.4 /100 | #181 | Fair 11.3% |
Demographics Similar to Immigrants from Cameroon by Male Disability
In terms of male disability, the demographic groups most similar to Immigrants from Cameroon are Immigrants from Serbia (10.5%, a difference of 0.060%), Immigrants from Lithuania (10.5%, a difference of 0.12%), Immigrants from Bulgaria (10.5%, a difference of 0.15%), Immigrants from Lebanon (10.5%, a difference of 0.26%), and Colombian (10.5%, a difference of 0.29%).
| Demographics | Rating | Rank | Male Disability |
| Jordanians | 99.3 /100 | #64 | Exceptional 10.5% |
| Immigrants | Grenada | 99.2 /100 | #65 | Exceptional 10.5% |
| Guyanese | 99.2 /100 | #66 | Exceptional 10.5% |
| Immigrants | Afghanistan | 99.2 /100 | #67 | Exceptional 10.5% |
| Colombians | 99.2 /100 | #68 | Exceptional 10.5% |
| Ecuadorians | 99.2 /100 | #69 | Exceptional 10.5% |
| Immigrants | Bulgaria | 99.1 /100 | #70 | Exceptional 10.5% |
| Immigrants | Cameroon | 99.0 /100 | #71 | Exceptional 10.5% |
| Immigrants | Serbia | 99.0 /100 | #72 | Exceptional 10.5% |
| Immigrants | Lithuania | 98.9 /100 | #73 | Exceptional 10.5% |
| Immigrants | Lebanon | 98.8 /100 | #74 | Exceptional 10.5% |
| Sierra Leoneans | 98.7 /100 | #75 | Exceptional 10.5% |
| Immigrants | Sierra Leone | 98.7 /100 | #76 | Exceptional 10.5% |
| Laotians | 98.6 /100 | #77 | Exceptional 10.6% |
| Immigrants | Russia | 98.6 /100 | #78 | Exceptional 10.6% |