Asian vs Austrian Male Disability
COMPARE
Asian
Austrian
Male Disability
Male Disability Comparison
Asians
Austrians
10.0%
MALE DISABILITY
100.0/ 100
METRIC RATING
20th/ 347
METRIC RANK
11.8%
MALE DISABILITY
2.5/ 100
METRIC RATING
227th/ 347
METRIC RANK
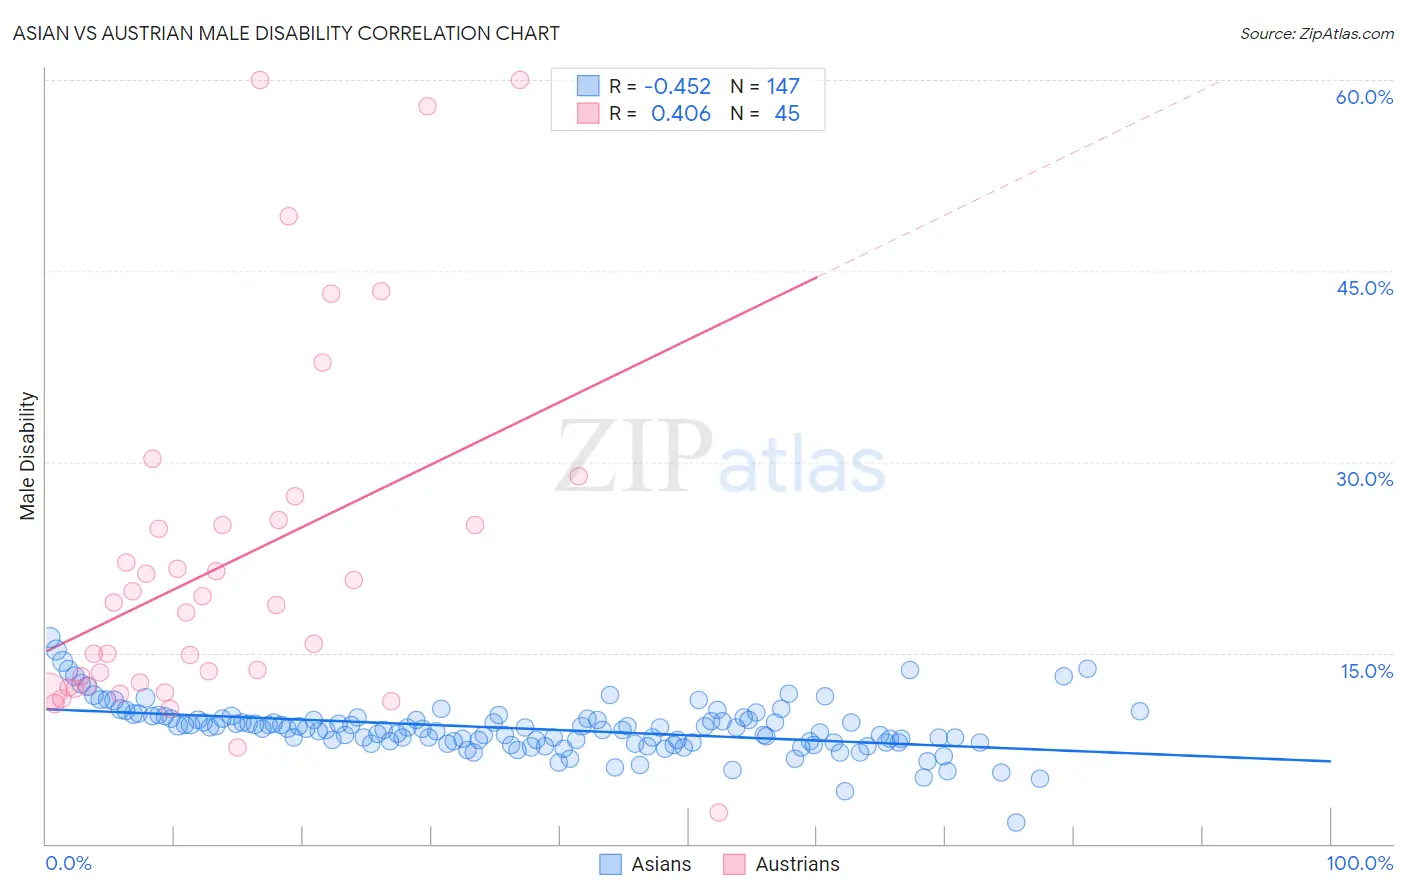
Asian vs Austrian Male Disability Correlation Chart
The statistical analysis conducted on geographies consisting of 550,680,295 people shows a moderate negative correlation between the proportion of Asians and percentage of males with a disability in the United States with a correlation coefficient (R) of -0.452 and weighted average of 10.0%. Similarly, the statistical analysis conducted on geographies consisting of 452,033,599 people shows a moderate positive correlation between the proportion of Austrians and percentage of males with a disability in the United States with a correlation coefficient (R) of 0.406 and weighted average of 11.8%, a difference of 18.3%.
Male Disability Correlation Summary
| Measurement | Asian | Austrian |
| Minimum | 1.6% | 2.5% |
| Maximum | 16.2% | 60.0% |
| Range | 14.6% | 57.5% |
| Mean | 9.0% | 22.1% |
| Median | 9.0% | 18.8% |
| Interquartile 25% (IQ1) | 7.9% | 12.3% |
| Interquartile 75% (IQ3) | 9.8% | 25.2% |
| Interquartile Range (IQR) | 1.8% | 12.9% |
| Standard Deviation (Sample) | 2.0% | 13.9% |
| Standard Deviation (Population) | 2.0% | 13.8% |
Similar Demographics by Male Disability
Demographics Similar to Asians by Male Disability
In terms of male disability, the demographic groups most similar to Asians are Immigrants from Sri Lanka (10.0%, a difference of 0.060%), Burmese (10.0%, a difference of 0.11%), Immigrants from Venezuela (10.0%, a difference of 0.39%), Cypriot (10.0%, a difference of 0.49%), and Immigrants from Asia (10.0%, a difference of 0.62%).
| Demographics | Rating | Rank | Male Disability |
| Iranians | 100.0 /100 | #13 | Exceptional 9.7% |
| Immigrants | Iran | 100.0 /100 | #14 | Exceptional 9.7% |
| Indians (Asian) | 100.0 /100 | #15 | Exceptional 9.7% |
| Okinawans | 100.0 /100 | #16 | Exceptional 9.8% |
| Immigrants | Korea | 100.0 /100 | #17 | Exceptional 9.8% |
| Immigrants | Pakistan | 100.0 /100 | #18 | Exceptional 9.8% |
| Immigrants | Sri Lanka | 100.0 /100 | #19 | Exceptional 10.0% |
| Asians | 100.0 /100 | #20 | Exceptional 10.0% |
| Burmese | 100.0 /100 | #21 | Exceptional 10.0% |
| Immigrants | Venezuela | 100.0 /100 | #22 | Exceptional 10.0% |
| Cypriots | 100.0 /100 | #23 | Exceptional 10.0% |
| Immigrants | Asia | 100.0 /100 | #24 | Exceptional 10.0% |
| Immigrants | Malaysia | 99.9 /100 | #25 | Exceptional 10.0% |
| Paraguayans | 99.9 /100 | #26 | Exceptional 10.1% |
| Egyptians | 99.9 /100 | #27 | Exceptional 10.1% |
Demographics Similar to Austrians by Male Disability
In terms of male disability, the demographic groups most similar to Austrians are Hispanic or Latino (11.8%, a difference of 0.080%), Bermudan (11.8%, a difference of 0.11%), Subsaharan African (11.8%, a difference of 0.18%), Croatian (11.8%, a difference of 0.20%), and Liberian (11.8%, a difference of 0.30%).
| Demographics | Rating | Rank | Male Disability |
| Immigrants | Western Europe | 3.8 /100 | #220 | Tragic 11.7% |
| Immigrants | Congo | 3.7 /100 | #221 | Tragic 11.7% |
| Alsatians | 3.3 /100 | #222 | Tragic 11.7% |
| Immigrants | Bahamas | 3.2 /100 | #223 | Tragic 11.7% |
| Japanese | 3.1 /100 | #224 | Tragic 11.7% |
| Liberians | 3.1 /100 | #225 | Tragic 11.8% |
| Sub-Saharan Africans | 2.8 /100 | #226 | Tragic 11.8% |
| Austrians | 2.5 /100 | #227 | Tragic 11.8% |
| Hispanics or Latinos | 2.3 /100 | #228 | Tragic 11.8% |
| Bermudans | 2.3 /100 | #229 | Tragic 11.8% |
| Croatians | 2.1 /100 | #230 | Tragic 11.8% |
| Dominicans | 1.8 /100 | #231 | Tragic 11.8% |
| Malaysians | 1.8 /100 | #232 | Tragic 11.8% |
| Mexicans | 1.7 /100 | #233 | Tragic 11.8% |
| Immigrants | Canada | 1.6 /100 | #234 | Tragic 11.9% |