Argentinean vs Immigrants from Western Europe Female Disability
COMPARE
Argentinean
Immigrants from Western Europe
Female Disability
Female Disability Comparison
Argentineans
Immigrants from Western Europe
11.0%
FEMALE DISABILITY
100.0/ 100
METRIC RATING
26th/ 347
METRIC RANK
12.2%
FEMALE DISABILITY
40.9/ 100
METRIC RATING
178th/ 347
METRIC RANK
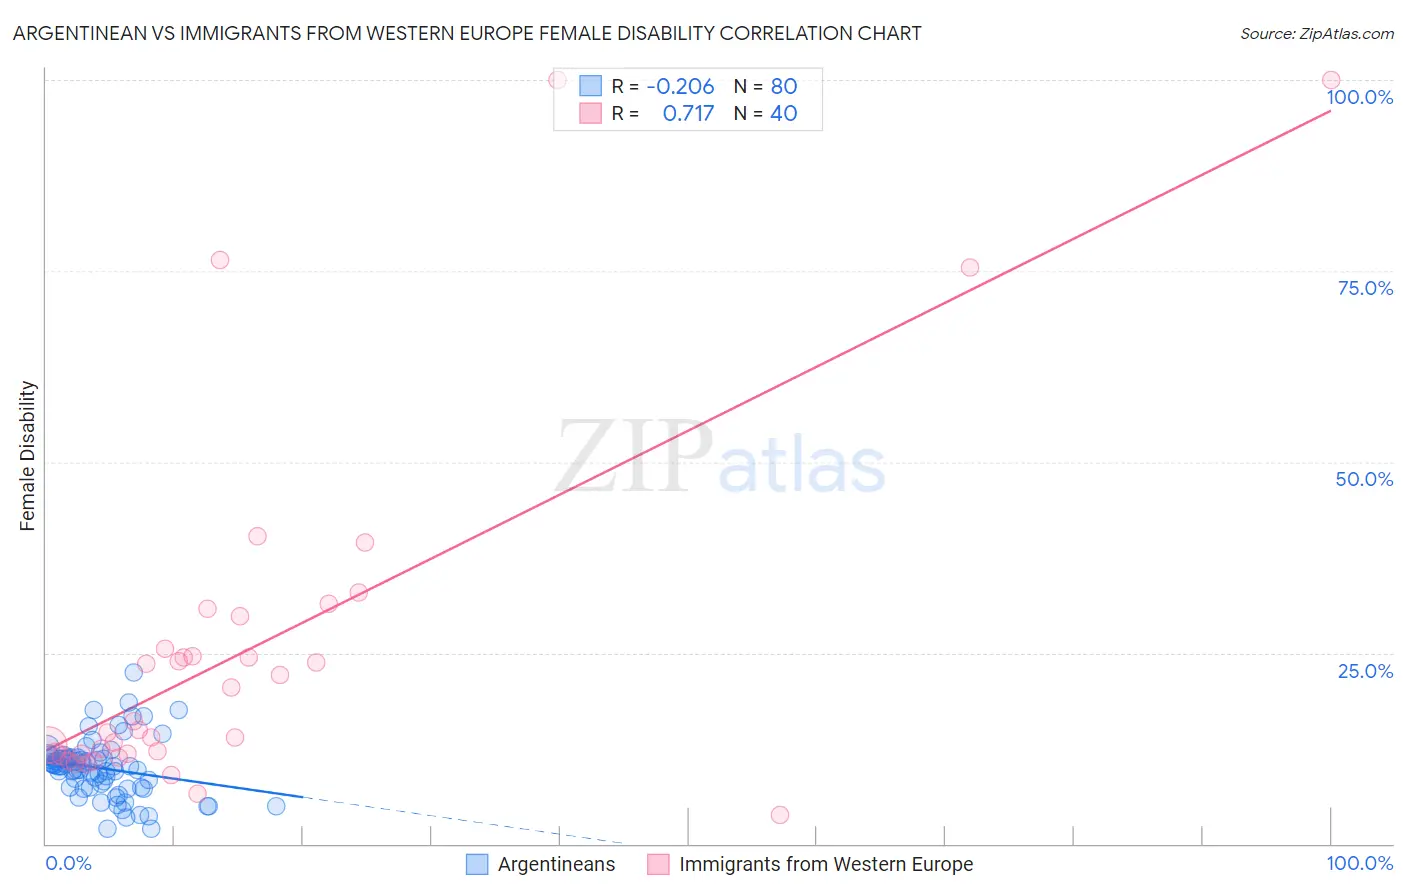
Argentinean vs Immigrants from Western Europe Female Disability Correlation Chart
The statistical analysis conducted on geographies consisting of 297,133,447 people shows a weak negative correlation between the proportion of Argentineans and percentage of females with a disability in the United States with a correlation coefficient (R) of -0.206 and weighted average of 11.0%. Similarly, the statistical analysis conducted on geographies consisting of 494,007,860 people shows a strong positive correlation between the proportion of Immigrants from Western Europe and percentage of females with a disability in the United States with a correlation coefficient (R) of 0.717 and weighted average of 12.2%, a difference of 11.0%.
Female Disability Correlation Summary
| Measurement | Argentinean | Immigrants from Western Europe |
| Minimum | 1.9% | 3.8% |
| Maximum | 22.3% | 100.0% |
| Range | 20.4% | 96.2% |
| Mean | 9.9% | 25.3% |
| Median | 10.2% | 15.5% |
| Interquartile 25% (IQ1) | 7.4% | 11.8% |
| Interquartile 75% (IQ3) | 11.3% | 27.7% |
| Interquartile Range (IQR) | 3.9% | 15.9% |
| Standard Deviation (Sample) | 3.8% | 23.2% |
| Standard Deviation (Population) | 3.7% | 22.9% |
Similar Demographics by Female Disability
Demographics Similar to Argentineans by Female Disability
In terms of female disability, the demographic groups most similar to Argentineans are Immigrants from Asia (11.0%, a difference of 0.040%), Immigrants from Argentina (11.0%, a difference of 0.070%), Immigrants from Turkey (11.1%, a difference of 0.40%), Venezuelan (11.0%, a difference of 0.64%), and Egyptian (11.1%, a difference of 0.67%).
| Demographics | Rating | Rank | Female Disability |
| Immigrants | Venezuela | 100.0 /100 | #19 | Exceptional 10.9% |
| Immigrants | Pakistan | 100.0 /100 | #20 | Exceptional 10.9% |
| Asians | 100.0 /100 | #21 | Exceptional 10.9% |
| Immigrants | Sri Lanka | 100.0 /100 | #22 | Exceptional 10.9% |
| Venezuelans | 100.0 /100 | #23 | Exceptional 11.0% |
| Immigrants | Argentina | 100.0 /100 | #24 | Exceptional 11.0% |
| Immigrants | Asia | 100.0 /100 | #25 | Exceptional 11.0% |
| Argentineans | 100.0 /100 | #26 | Exceptional 11.0% |
| Immigrants | Turkey | 100.0 /100 | #27 | Exceptional 11.1% |
| Egyptians | 100.0 /100 | #28 | Exceptional 11.1% |
| Immigrants | Malaysia | 100.0 /100 | #29 | Exceptional 11.1% |
| Turks | 100.0 /100 | #30 | Exceptional 11.1% |
| Immigrants | Kuwait | 100.0 /100 | #31 | Exceptional 11.1% |
| Immigrants | Australia | 100.0 /100 | #32 | Exceptional 11.1% |
| Immigrants | Egypt | 100.0 /100 | #33 | Exceptional 11.1% |
Demographics Similar to Immigrants from Western Europe by Female Disability
In terms of female disability, the demographic groups most similar to Immigrants from Western Europe are Immigrants from Ghana (12.2%, a difference of 0.060%), Immigrants from Guyana (12.2%, a difference of 0.080%), Immigrants from Fiji (12.3%, a difference of 0.11%), Albanian (12.3%, a difference of 0.12%), and Immigrants from Canada (12.3%, a difference of 0.15%).
| Demographics | Rating | Rank | Female Disability |
| Immigrants | Southern Europe | 56.3 /100 | #171 | Average 12.2% |
| Haitians | 51.9 /100 | #172 | Average 12.2% |
| Immigrants | Mexico | 50.8 /100 | #173 | Average 12.2% |
| Immigrants | England | 50.0 /100 | #174 | Average 12.2% |
| Immigrants | St. Vincent and the Grenadines | 49.7 /100 | #175 | Average 12.2% |
| Immigrants | Guyana | 43.1 /100 | #176 | Average 12.2% |
| Immigrants | Ghana | 42.5 /100 | #177 | Average 12.2% |
| Immigrants | Western Europe | 40.9 /100 | #178 | Average 12.2% |
| Immigrants | Fiji | 38.2 /100 | #179 | Fair 12.3% |
| Albanians | 37.9 /100 | #180 | Fair 12.3% |
| Immigrants | Canada | 37.2 /100 | #181 | Fair 12.3% |
| Norwegians | 36.9 /100 | #182 | Fair 12.3% |
| Cubans | 36.5 /100 | #183 | Fair 12.3% |
| Iraqis | 36.0 /100 | #184 | Fair 12.3% |
| Immigrants | Uzbekistan | 33.9 /100 | #185 | Fair 12.3% |