American vs Icelander Disability
COMPARE
American
Icelander
Disability
Disability Comparison
Americans
Icelanders
13.9%
DISABILITY
0.0/ 100
METRIC RATING
322nd/ 347
METRIC RANK
11.8%
DISABILITY
34.0/ 100
METRIC RATING
182nd/ 347
METRIC RANK
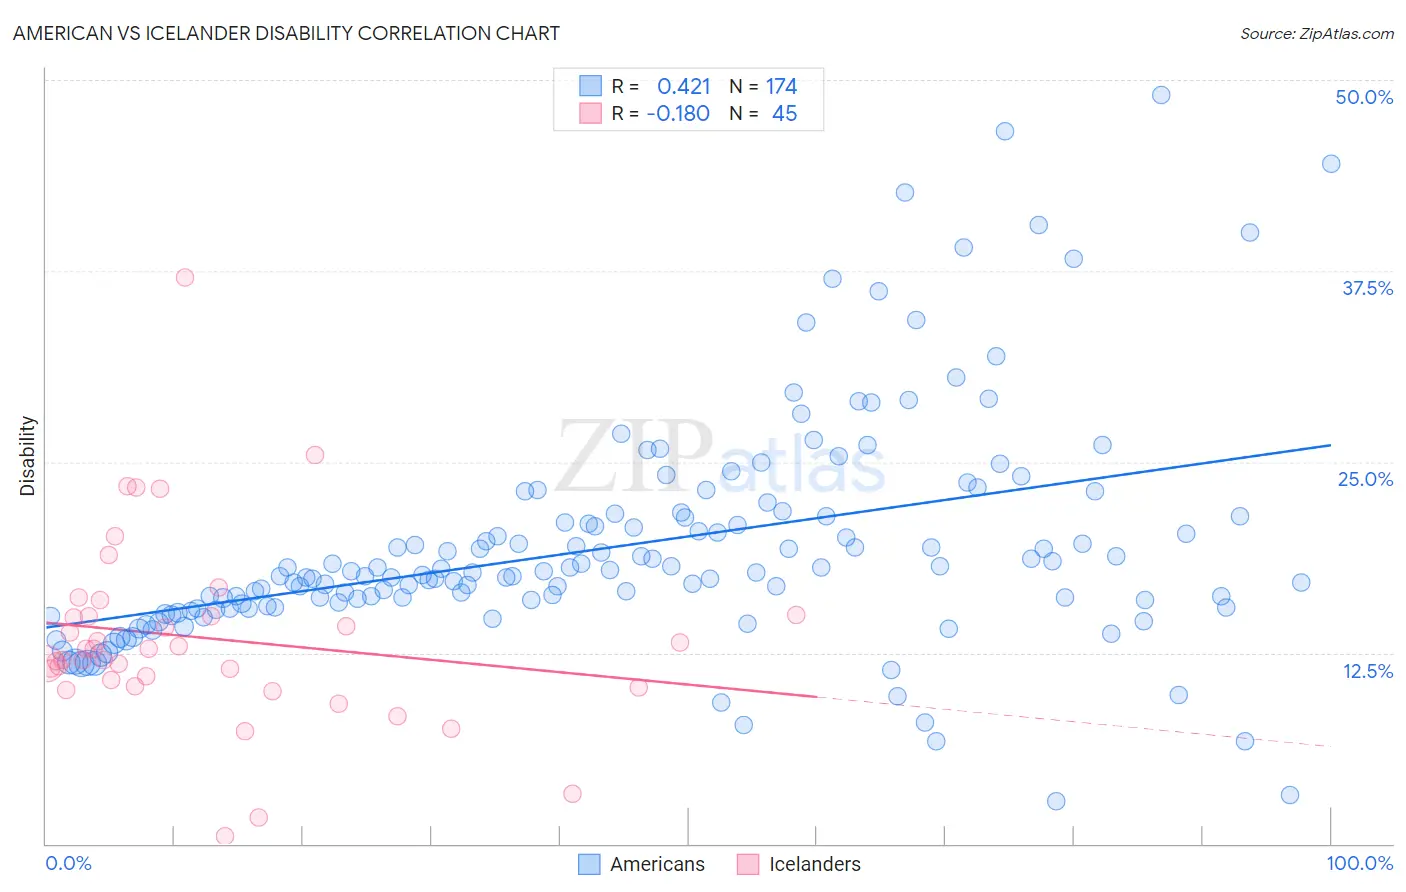
American vs Icelander Disability Correlation Chart
The statistical analysis conducted on geographies consisting of 581,794,262 people shows a moderate positive correlation between the proportion of Americans and percentage of population with a disability in the United States with a correlation coefficient (R) of 0.421 and weighted average of 13.9%. Similarly, the statistical analysis conducted on geographies consisting of 159,644,692 people shows a poor negative correlation between the proportion of Icelanders and percentage of population with a disability in the United States with a correlation coefficient (R) of -0.180 and weighted average of 11.8%, a difference of 18.2%.
Disability Correlation Summary
| Measurement | American | Icelander |
| Minimum | 2.8% | 0.46% |
| Maximum | 49.1% | 37.1% |
| Range | 46.3% | 36.6% |
| Mean | 19.4% | 13.5% |
| Median | 17.7% | 12.7% |
| Interquartile 25% (IQ1) | 15.4% | 10.5% |
| Interquartile 75% (IQ3) | 21.4% | 15.0% |
| Interquartile Range (IQR) | 6.0% | 4.4% |
| Standard Deviation (Sample) | 7.5% | 6.2% |
| Standard Deviation (Population) | 7.5% | 6.2% |
Similar Demographics by Disability
Demographics Similar to Americans by Disability
In terms of disability, the demographic groups most similar to Americans are Paiute (13.9%, a difference of 0.42%), Apache (13.9%, a difference of 0.55%), Iroquois (13.8%, a difference of 0.84%), Menominee (13.8%, a difference of 1.1%), and Comanche (14.1%, a difference of 1.3%).
| Demographics | Rating | Rank | Disability |
| Puget Sound Salish | 0.0 /100 | #315 | Tragic 13.7% |
| Pima | 0.0 /100 | #316 | Tragic 13.7% |
| Immigrants | Cabo Verde | 0.0 /100 | #317 | Tragic 13.7% |
| Menominee | 0.0 /100 | #318 | Tragic 13.8% |
| Iroquois | 0.0 /100 | #319 | Tragic 13.8% |
| Apache | 0.0 /100 | #320 | Tragic 13.9% |
| Paiute | 0.0 /100 | #321 | Tragic 13.9% |
| Americans | 0.0 /100 | #322 | Tragic 13.9% |
| Comanche | 0.0 /100 | #323 | Tragic 14.1% |
| Chippewa | 0.0 /100 | #324 | Tragic 14.1% |
| Natives/Alaskans | 0.0 /100 | #325 | Tragic 14.2% |
| Osage | 0.0 /100 | #326 | Tragic 14.2% |
| Ottawa | 0.0 /100 | #327 | Tragic 14.2% |
| Immigrants | Azores | 0.0 /100 | #328 | Tragic 14.2% |
| Potawatomi | 0.0 /100 | #329 | Tragic 14.2% |
Demographics Similar to Icelanders by Disability
In terms of disability, the demographic groups most similar to Icelanders are Immigrants from Oceania (11.8%, a difference of 0.010%), Honduran (11.8%, a difference of 0.14%), Immigrants from Honduras (11.8%, a difference of 0.19%), Iraqi (11.8%, a difference of 0.20%), and Immigrants from Burma/Myanmar (11.8%, a difference of 0.28%).
| Demographics | Rating | Rank | Disability |
| Haitians | 48.6 /100 | #175 | Average 11.7% |
| Immigrants | Western Africa | 47.5 /100 | #176 | Average 11.7% |
| Immigrants | Central America | 46.6 /100 | #177 | Average 11.7% |
| Greeks | 46.2 /100 | #178 | Average 11.7% |
| Immigrants | Armenia | 41.9 /100 | #179 | Average 11.7% |
| Immigrants | Honduras | 37.8 /100 | #180 | Fair 11.8% |
| Immigrants | Oceania | 34.3 /100 | #181 | Fair 11.8% |
| Icelanders | 34.0 /100 | #182 | Fair 11.8% |
| Hondurans | 31.2 /100 | #183 | Fair 11.8% |
| Iraqis | 30.0 /100 | #184 | Fair 11.8% |
| Immigrants | Burma/Myanmar | 28.5 /100 | #185 | Fair 11.8% |
| Immigrants | Scotland | 28.2 /100 | #186 | Fair 11.8% |
| Lebanese | 27.9 /100 | #187 | Fair 11.8% |
| Immigrants | Mexico | 23.8 /100 | #188 | Fair 11.9% |
| Immigrants | Zaire | 21.8 /100 | #189 | Fair 11.9% |