Argentinean vs Icelander Single Father Households
COMPARE
Argentinean
Icelander
Single Father Households
Single Father Households Comparison
Argentineans
Icelanders
2.1%
SINGLE FATHER HOUSEHOLDS
98.9/ 100
METRIC RATING
102nd/ 347
METRIC RANK
2.3%
SINGLE FATHER HOUSEHOLDS
63.1/ 100
METRIC RATING
168th/ 347
METRIC RANK
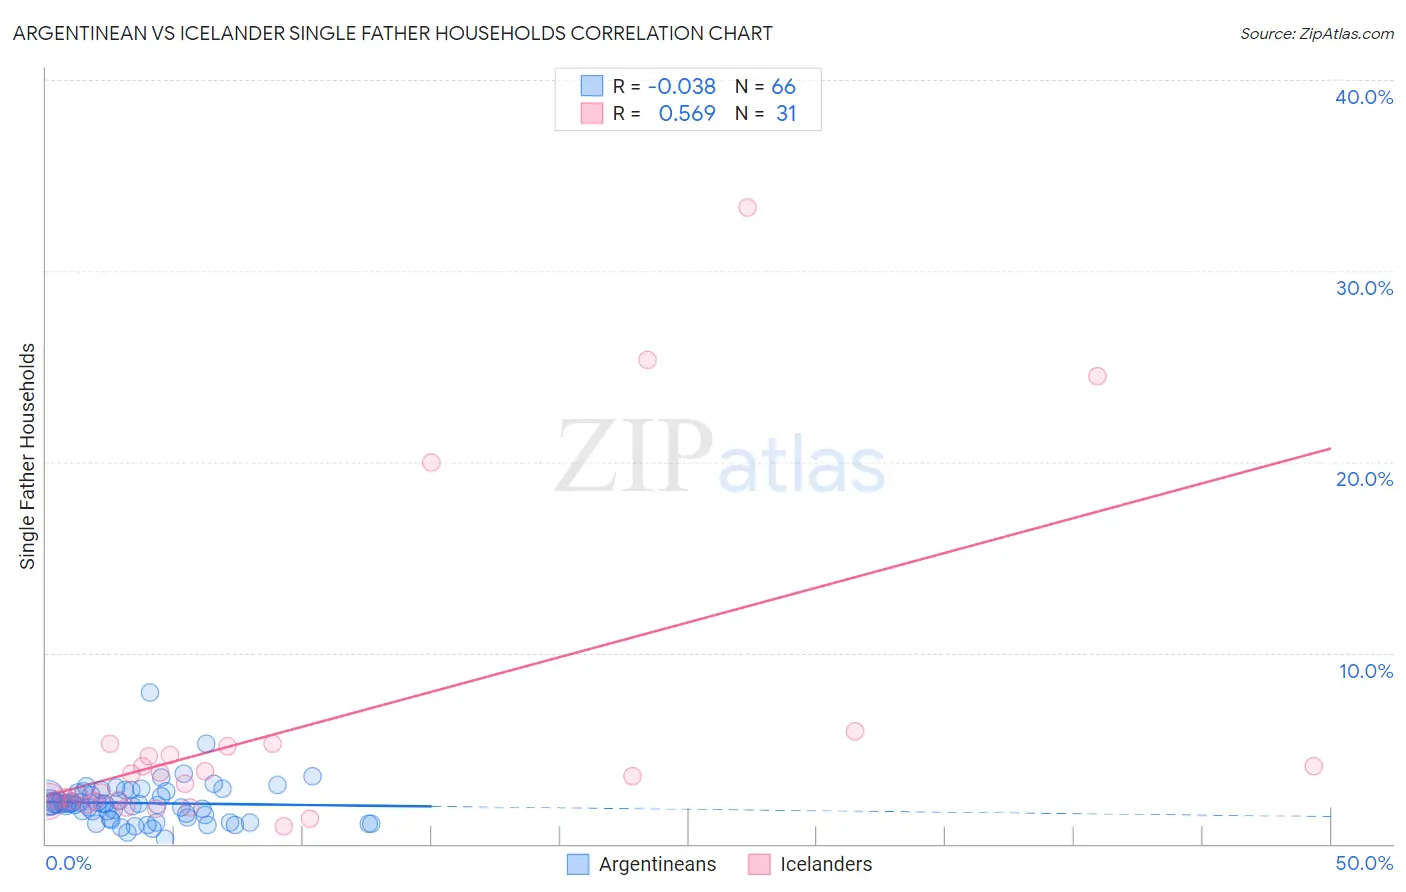
Argentinean vs Icelander Single Father Households Correlation Chart
The statistical analysis conducted on geographies consisting of 295,652,417 people shows no correlation between the proportion of Argentineans and percentage of single father households in the United States with a correlation coefficient (R) of -0.038 and weighted average of 2.1%. Similarly, the statistical analysis conducted on geographies consisting of 159,015,107 people shows a substantial positive correlation between the proportion of Icelanders and percentage of single father households in the United States with a correlation coefficient (R) of 0.569 and weighted average of 2.3%, a difference of 7.9%.
Single Father Households Correlation Summary
| Measurement | Argentinean | Icelander |
| Minimum | 0.26% | 0.94% |
| Maximum | 7.9% | 33.3% |
| Range | 7.6% | 32.4% |
| Mean | 2.1% | 6.1% |
| Median | 2.1% | 3.5% |
| Interquartile 25% (IQ1) | 1.4% | 2.2% |
| Interquartile 75% (IQ3) | 2.7% | 5.1% |
| Interquartile Range (IQR) | 1.3% | 2.9% |
| Standard Deviation (Sample) | 1.1% | 8.0% |
| Standard Deviation (Population) | 1.1% | 7.9% |
Similar Demographics by Single Father Households
Demographics Similar to Argentineans by Single Father Households
In terms of single father households, the demographic groups most similar to Argentineans are Lebanese (2.1%, a difference of 0.020%), Immigrants from Western Europe (2.1%, a difference of 0.030%), Alsatian (2.1%, a difference of 0.040%), Immigrants from Northern Africa (2.1%, a difference of 0.18%), and South African (2.1%, a difference of 0.33%).
| Demographics | Rating | Rank | Single Father Households |
| Bermudans | 99.2 /100 | #95 | Exceptional 2.1% |
| Arabs | 99.2 /100 | #96 | Exceptional 2.1% |
| Immigrants | Moldova | 99.1 /100 | #97 | Exceptional 2.1% |
| Guyanese | 99.1 /100 | #98 | Exceptional 2.1% |
| South Africans | 99.1 /100 | #99 | Exceptional 2.1% |
| Immigrants | Northern Africa | 99.0 /100 | #100 | Exceptional 2.1% |
| Immigrants | Western Europe | 98.9 /100 | #101 | Exceptional 2.1% |
| Argentineans | 98.9 /100 | #102 | Exceptional 2.1% |
| Lebanese | 98.9 /100 | #103 | Exceptional 2.1% |
| Alsatians | 98.9 /100 | #104 | Exceptional 2.1% |
| Palestinians | 98.6 /100 | #105 | Exceptional 2.2% |
| Immigrants | Southern Europe | 98.6 /100 | #106 | Exceptional 2.2% |
| Slovenes | 98.5 /100 | #107 | Exceptional 2.2% |
| Immigrants | Netherlands | 98.5 /100 | #108 | Exceptional 2.2% |
| Barbadians | 98.4 /100 | #109 | Exceptional 2.2% |
Demographics Similar to Icelanders by Single Father Households
In terms of single father households, the demographic groups most similar to Icelanders are Czech (2.3%, a difference of 0.040%), Ugandan (2.3%, a difference of 0.070%), South American (2.3%, a difference of 0.10%), Swedish (2.3%, a difference of 0.12%), and Czechoslovakian (2.3%, a difference of 0.33%).
| Demographics | Rating | Rank | Single Father Households |
| Swiss | 73.2 /100 | #161 | Good 2.3% |
| Scottish | 72.8 /100 | #162 | Good 2.3% |
| Irish | 72.1 /100 | #163 | Good 2.3% |
| Pakistanis | 70.6 /100 | #164 | Good 2.3% |
| Scotch-Irish | 69.4 /100 | #165 | Good 2.3% |
| English | 68.6 /100 | #166 | Good 2.3% |
| South Americans | 64.3 /100 | #167 | Good 2.3% |
| Icelanders | 63.1 /100 | #168 | Good 2.3% |
| Czechs | 62.5 /100 | #169 | Good 2.3% |
| Ugandans | 62.2 /100 | #170 | Good 2.3% |
| Swedes | 61.6 /100 | #171 | Good 2.3% |
| Czechoslovakians | 58.9 /100 | #172 | Average 2.3% |
| Celtics | 55.4 /100 | #173 | Average 2.3% |
| Afghans | 50.0 /100 | #174 | Average 2.3% |
| Immigrants | Jamaica | 49.1 /100 | #175 | Average 2.3% |