Arab vs U.S. Virgin Islander Disability Age 5 to 17
COMPARE
Arab
U.S. Virgin Islander
Disability Age 5 to 17
Disability Age 5 to 17 Comparison
Arabs
U.S. Virgin Islanders
5.4%
DISABILITY AGE 5 TO 17
92.9/ 100
METRIC RATING
131st/ 347
METRIC RANK
6.3%
DISABILITY AGE 5 TO 17
0.0/ 100
METRIC RATING
301st/ 347
METRIC RANK
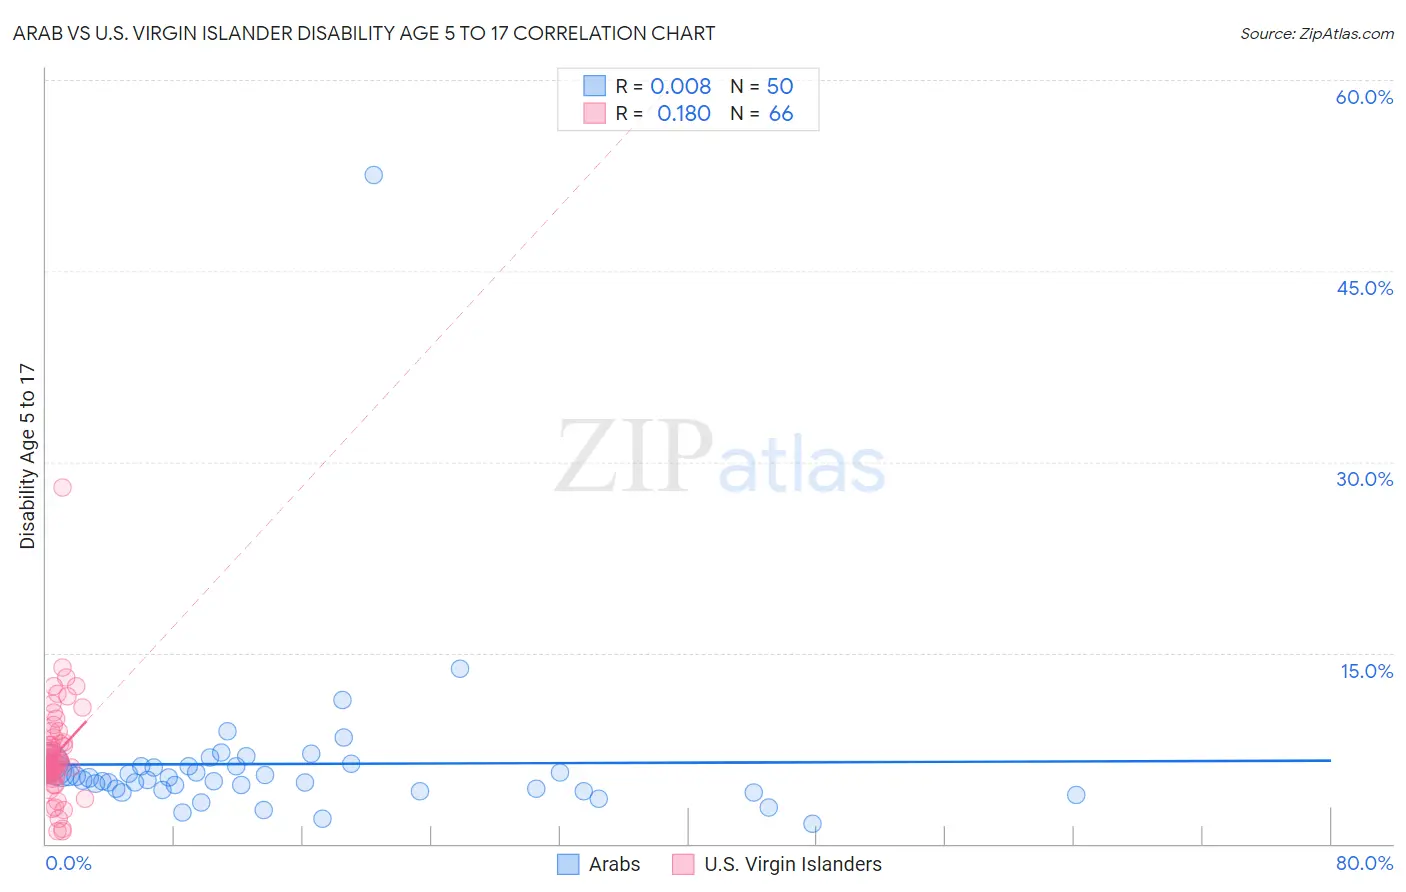
Arab vs U.S. Virgin Islander Disability Age 5 to 17 Correlation Chart
The statistical analysis conducted on geographies consisting of 481,041,182 people shows no correlation between the proportion of Arabs and percentage of population with a disability between the ages 5 and 17 in the United States with a correlation coefficient (R) of 0.008 and weighted average of 5.4%. Similarly, the statistical analysis conducted on geographies consisting of 87,363,658 people shows a poor positive correlation between the proportion of U.S. Virgin Islanders and percentage of population with a disability between the ages 5 and 17 in the United States with a correlation coefficient (R) of 0.180 and weighted average of 6.3%, a difference of 15.5%.
Disability Age 5 to 17 Correlation Summary
| Measurement | Arab | U.S. Virgin Islander |
| Minimum | 1.6% | 0.97% |
| Maximum | 52.5% | 27.9% |
| Range | 50.9% | 27.0% |
| Mean | 6.3% | 7.0% |
| Median | 5.1% | 6.4% |
| Interquartile 25% (IQ1) | 4.2% | 5.5% |
| Interquartile 75% (IQ3) | 6.1% | 7.8% |
| Interquartile Range (IQR) | 1.9% | 2.3% |
| Standard Deviation (Sample) | 7.0% | 3.8% |
| Standard Deviation (Population) | 6.9% | 3.8% |
Similar Demographics by Disability Age 5 to 17
Demographics Similar to Arabs by Disability Age 5 to 17
In terms of disability age 5 to 17, the demographic groups most similar to Arabs are Immigrants from Colombia (5.4%, a difference of 0.020%), Venezuelan (5.4%, a difference of 0.050%), Yuman (5.4%, a difference of 0.13%), Immigrants from Belize (5.4%, a difference of 0.22%), and Immigrants from Bulgaria (5.4%, a difference of 0.23%).
| Demographics | Rating | Rank | Disability Age 5 to 17 |
| Crow | 95.0 /100 | #124 | Exceptional 5.4% |
| Immigrants | Chile | 95.0 /100 | #125 | Exceptional 5.4% |
| New Zealanders | 95.0 /100 | #126 | Exceptional 5.4% |
| Latvians | 95.0 /100 | #127 | Exceptional 5.4% |
| Immigrants | Venezuela | 94.5 /100 | #128 | Exceptional 5.4% |
| Romanians | 94.1 /100 | #129 | Exceptional 5.4% |
| Immigrants | Bulgaria | 94.0 /100 | #130 | Exceptional 5.4% |
| Arabs | 92.9 /100 | #131 | Exceptional 5.4% |
| Immigrants | Colombia | 92.9 /100 | #132 | Exceptional 5.4% |
| Venezuelans | 92.7 /100 | #133 | Exceptional 5.4% |
| Yuman | 92.3 /100 | #134 | Exceptional 5.4% |
| Immigrants | Belize | 91.7 /100 | #135 | Exceptional 5.4% |
| Immigrants | Denmark | 91.4 /100 | #136 | Exceptional 5.4% |
| Navajo | 90.9 /100 | #137 | Exceptional 5.4% |
| Immigrants | Oceania | 90.8 /100 | #138 | Exceptional 5.4% |
Demographics Similar to U.S. Virgin Islanders by Disability Age 5 to 17
In terms of disability age 5 to 17, the demographic groups most similar to U.S. Virgin Islanders are Carpatho Rusyn (6.3%, a difference of 0.020%), Welsh (6.3%, a difference of 0.14%), Lumbee (6.2%, a difference of 0.29%), Celtic (6.3%, a difference of 0.33%), and Immigrants from Bahamas (6.2%, a difference of 0.36%).
| Demographics | Rating | Rank | Disability Age 5 to 17 |
| Irish | 0.0 /100 | #294 | Tragic 6.2% |
| Cree | 0.0 /100 | #295 | Tragic 6.2% |
| Spanish Americans | 0.0 /100 | #296 | Tragic 6.2% |
| Immigrants | Bahamas | 0.0 /100 | #297 | Tragic 6.2% |
| Lumbee | 0.0 /100 | #298 | Tragic 6.2% |
| Welsh | 0.0 /100 | #299 | Tragic 6.3% |
| Carpatho Rusyns | 0.0 /100 | #300 | Tragic 6.3% |
| U.S. Virgin Islanders | 0.0 /100 | #301 | Tragic 6.3% |
| Celtics | 0.0 /100 | #302 | Tragic 6.3% |
| Yakama | 0.0 /100 | #303 | Tragic 6.3% |
| Senegalese | 0.0 /100 | #304 | Tragic 6.3% |
| Natives/Alaskans | 0.0 /100 | #305 | Tragic 6.3% |
| Immigrants | Nonimmigrants | 0.0 /100 | #306 | Tragic 6.3% |
| Bahamians | 0.0 /100 | #307 | Tragic 6.3% |
| Scotch-Irish | 0.0 /100 | #308 | Tragic 6.3% |