Australian vs U.S. Virgin Islander Disability Age 5 to 17
COMPARE
Australian
U.S. Virgin Islander
Disability Age 5 to 17
Disability Age 5 to 17 Comparison
Australians
U.S. Virgin Islanders
5.5%
DISABILITY AGE 5 TO 17
78.8/ 100
METRIC RATING
154th/ 347
METRIC RANK
6.3%
DISABILITY AGE 5 TO 17
0.0/ 100
METRIC RATING
301st/ 347
METRIC RANK
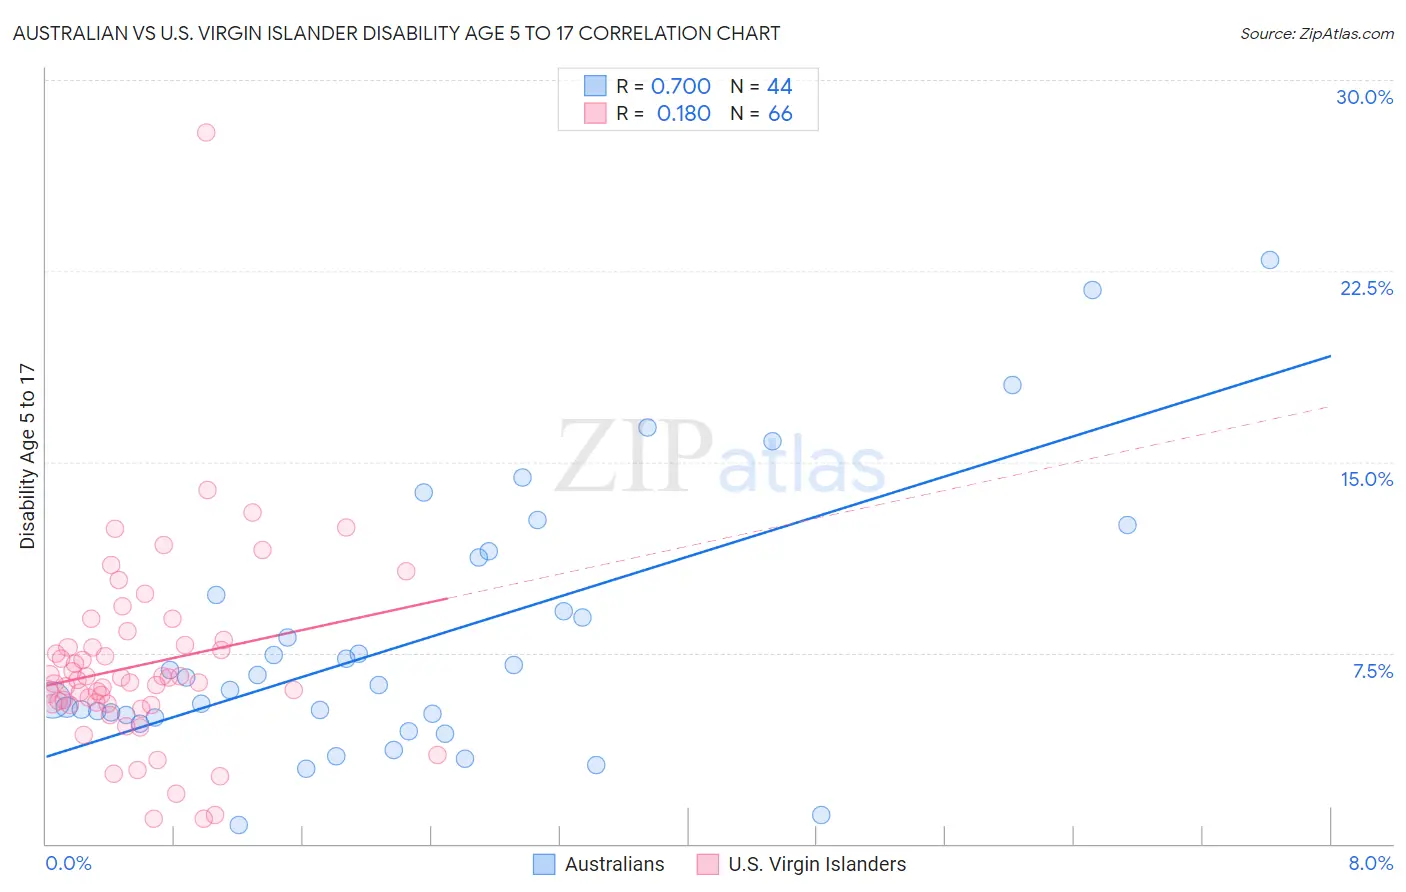
Australian vs U.S. Virgin Islander Disability Age 5 to 17 Correlation Chart
The statistical analysis conducted on geographies consisting of 222,865,567 people shows a strong positive correlation between the proportion of Australians and percentage of population with a disability between the ages 5 and 17 in the United States with a correlation coefficient (R) of 0.700 and weighted average of 5.5%. Similarly, the statistical analysis conducted on geographies consisting of 87,363,658 people shows a poor positive correlation between the proportion of U.S. Virgin Islanders and percentage of population with a disability between the ages 5 and 17 in the United States with a correlation coefficient (R) of 0.180 and weighted average of 6.3%, a difference of 13.7%.
Disability Age 5 to 17 Correlation Summary
| Measurement | Australian | U.S. Virgin Islander |
| Minimum | 0.74% | 0.97% |
| Maximum | 23.0% | 27.9% |
| Range | 22.2% | 27.0% |
| Mean | 8.0% | 7.0% |
| Median | 6.4% | 6.4% |
| Interquartile 25% (IQ1) | 5.0% | 5.5% |
| Interquartile 75% (IQ3) | 10.5% | 7.8% |
| Interquartile Range (IQR) | 5.5% | 2.3% |
| Standard Deviation (Sample) | 5.1% | 3.8% |
| Standard Deviation (Population) | 5.1% | 3.8% |
Similar Demographics by Disability Age 5 to 17
Demographics Similar to Australians by Disability Age 5 to 17
In terms of disability age 5 to 17, the demographic groups most similar to Australians are Immigrants from Ecuador (5.5%, a difference of 0.040%), Hawaiian (5.5%, a difference of 0.060%), Ecuadorian (5.5%, a difference of 0.070%), Immigrants from Costa Rica (5.5%, a difference of 0.070%), and Immigrants from Nepal (5.5%, a difference of 0.12%).
| Demographics | Rating | Rank | Disability Age 5 to 17 |
| Immigrants | Albania | 83.1 /100 | #147 | Excellent 5.5% |
| Samoans | 81.9 /100 | #148 | Excellent 5.5% |
| Central Americans | 81.6 /100 | #149 | Excellent 5.5% |
| Guatemalans | 81.5 /100 | #150 | Excellent 5.5% |
| Estonians | 80.8 /100 | #151 | Excellent 5.5% |
| Ute | 80.6 /100 | #152 | Excellent 5.5% |
| Ecuadorians | 79.7 /100 | #153 | Good 5.5% |
| Australians | 78.8 /100 | #154 | Good 5.5% |
| Immigrants | Ecuador | 78.3 /100 | #155 | Good 5.5% |
| Hawaiians | 78.0 /100 | #156 | Good 5.5% |
| Immigrants | Costa Rica | 77.9 /100 | #157 | Good 5.5% |
| Immigrants | Nepal | 77.1 /100 | #158 | Good 5.5% |
| Immigrants | Zimbabwe | 75.3 /100 | #159 | Good 5.5% |
| South Africans | 73.3 /100 | #160 | Good 5.5% |
| Immigrants | Saudi Arabia | 69.1 /100 | #161 | Good 5.5% |
Demographics Similar to U.S. Virgin Islanders by Disability Age 5 to 17
In terms of disability age 5 to 17, the demographic groups most similar to U.S. Virgin Islanders are Carpatho Rusyn (6.3%, a difference of 0.020%), Welsh (6.3%, a difference of 0.14%), Lumbee (6.2%, a difference of 0.29%), Celtic (6.3%, a difference of 0.33%), and Immigrants from Bahamas (6.2%, a difference of 0.36%).
| Demographics | Rating | Rank | Disability Age 5 to 17 |
| Irish | 0.0 /100 | #294 | Tragic 6.2% |
| Cree | 0.0 /100 | #295 | Tragic 6.2% |
| Spanish Americans | 0.0 /100 | #296 | Tragic 6.2% |
| Immigrants | Bahamas | 0.0 /100 | #297 | Tragic 6.2% |
| Lumbee | 0.0 /100 | #298 | Tragic 6.2% |
| Welsh | 0.0 /100 | #299 | Tragic 6.3% |
| Carpatho Rusyns | 0.0 /100 | #300 | Tragic 6.3% |
| U.S. Virgin Islanders | 0.0 /100 | #301 | Tragic 6.3% |
| Celtics | 0.0 /100 | #302 | Tragic 6.3% |
| Yakama | 0.0 /100 | #303 | Tragic 6.3% |
| Senegalese | 0.0 /100 | #304 | Tragic 6.3% |
| Natives/Alaskans | 0.0 /100 | #305 | Tragic 6.3% |
| Immigrants | Nonimmigrants | 0.0 /100 | #306 | Tragic 6.3% |
| Bahamians | 0.0 /100 | #307 | Tragic 6.3% |
| Scotch-Irish | 0.0 /100 | #308 | Tragic 6.3% |