Arab vs Immigrants from Jamaica Child Poverty Under the Age of 16
COMPARE
Arab
Immigrants from Jamaica
Child Poverty Under the Age of 16
Child Poverty Under the Age of 16 Comparison
Arabs
Immigrants from Jamaica
16.6%
CHILD POVERTY UNDER THE AGE OF 16
31.4/ 100
METRIC RATING
187th/ 347
METRIC RANK
19.8%
CHILD POVERTY UNDER THE AGE OF 16
0.1/ 100
METRIC RATING
273rd/ 347
METRIC RANK
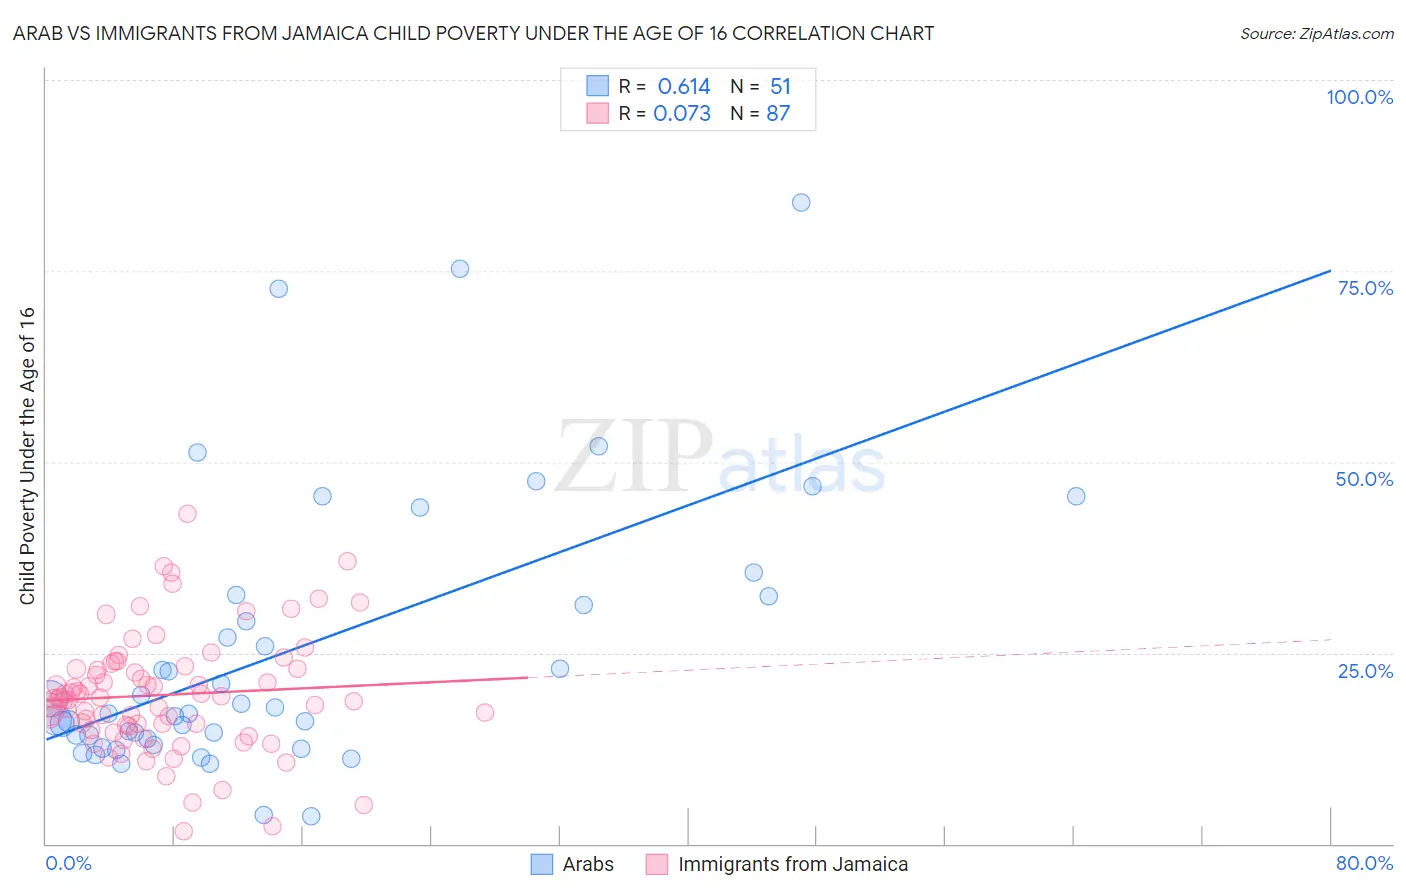
Arab vs Immigrants from Jamaica Child Poverty Under the Age of 16 Correlation Chart
The statistical analysis conducted on geographies consisting of 480,274,092 people shows a significant positive correlation between the proportion of Arabs and poverty level among children under the age of 16 in the United States with a correlation coefficient (R) of 0.614 and weighted average of 16.6%. Similarly, the statistical analysis conducted on geographies consisting of 299,947,677 people shows a slight positive correlation between the proportion of Immigrants from Jamaica and poverty level among children under the age of 16 in the United States with a correlation coefficient (R) of 0.073 and weighted average of 19.8%, a difference of 19.5%.
Child Poverty Under the Age of 16 Correlation Summary
| Measurement | Arab | Immigrants from Jamaica |
| Minimum | 3.6% | 1.6% |
| Maximum | 84.0% | 43.2% |
| Range | 80.4% | 41.6% |
| Mean | 25.2% | 19.5% |
| Median | 17.1% | 19.0% |
| Interquartile 25% (IQ1) | 13.8% | 15.4% |
| Interquartile 75% (IQ3) | 32.4% | 22.9% |
| Interquartile Range (IQR) | 18.6% | 7.5% |
| Standard Deviation (Sample) | 18.1% | 7.6% |
| Standard Deviation (Population) | 17.9% | 7.5% |
Similar Demographics by Child Poverty Under the Age of 16
Demographics Similar to Arabs by Child Poverty Under the Age of 16
In terms of child poverty under the age of 16, the demographic groups most similar to Arabs are Immigrants from Morocco (16.6%, a difference of 0.020%), Immigrants from Portugal (16.6%, a difference of 0.19%), Immigrants from Costa Rica (16.6%, a difference of 0.24%), Kenyan (16.5%, a difference of 0.36%), and Immigrants from Iraq (16.7%, a difference of 0.44%).
| Demographics | Rating | Rank | Child Poverty Under the Age of 16 |
| South American Indians | 41.8 /100 | #180 | Average 16.4% |
| Immigrants | South America | 40.8 /100 | #181 | Average 16.4% |
| Hawaiians | 38.2 /100 | #182 | Fair 16.4% |
| Celtics | 38.2 /100 | #183 | Fair 16.4% |
| Immigrants | Western Asia | 38.0 /100 | #184 | Fair 16.4% |
| Immigrants | Bosnia and Herzegovina | 37.4 /100 | #185 | Fair 16.5% |
| Kenyans | 34.1 /100 | #186 | Fair 16.5% |
| Arabs | 31.4 /100 | #187 | Fair 16.6% |
| Immigrants | Morocco | 31.2 /100 | #188 | Fair 16.6% |
| Immigrants | Portugal | 30.0 /100 | #189 | Fair 16.6% |
| Immigrants | Costa Rica | 29.6 /100 | #190 | Fair 16.6% |
| Immigrants | Iraq | 28.3 /100 | #191 | Fair 16.7% |
| Spanish | 24.5 /100 | #192 | Fair 16.7% |
| Spaniards | 23.2 /100 | #193 | Fair 16.8% |
| Immigrants | Uruguay | 23.1 /100 | #194 | Fair 16.8% |
Demographics Similar to Immigrants from Jamaica by Child Poverty Under the Age of 16
In terms of child poverty under the age of 16, the demographic groups most similar to Immigrants from Jamaica are Immigrants from Cabo Verde (19.9%, a difference of 0.15%), Immigrants from Barbados (19.9%, a difference of 0.16%), Belizean (19.9%, a difference of 0.16%), Immigrants from Bangladesh (19.8%, a difference of 0.24%), and Iroquois (19.9%, a difference of 0.30%).
| Demographics | Rating | Rank | Child Poverty Under the Age of 16 |
| Liberians | 0.1 /100 | #266 | Tragic 19.5% |
| Cherokee | 0.1 /100 | #267 | Tragic 19.5% |
| Jamaicans | 0.1 /100 | #268 | Tragic 19.7% |
| Immigrants | El Salvador | 0.1 /100 | #269 | Tragic 19.7% |
| Spanish American Indians | 0.1 /100 | #270 | Tragic 19.7% |
| Immigrants | Liberia | 0.1 /100 | #271 | Tragic 19.7% |
| Immigrants | Bangladesh | 0.1 /100 | #272 | Tragic 19.8% |
| Immigrants | Jamaica | 0.1 /100 | #273 | Tragic 19.8% |
| Immigrants | Cabo Verde | 0.1 /100 | #274 | Tragic 19.9% |
| Immigrants | Barbados | 0.1 /100 | #275 | Tragic 19.9% |
| Belizeans | 0.1 /100 | #276 | Tragic 19.9% |
| Iroquois | 0.1 /100 | #277 | Tragic 19.9% |
| Bangladeshis | 0.0 /100 | #278 | Tragic 19.9% |
| Sub-Saharan Africans | 0.0 /100 | #279 | Tragic 19.9% |
| Comanche | 0.0 /100 | #280 | Tragic 19.9% |