Cape Verdean vs Immigrants from Venezuela Self-Care Disability
COMPARE
Cape Verdean
Immigrants from Venezuela
Self-Care Disability
Self-Care Disability Comparison
Cape Verdeans
Immigrants from Venezuela
3.0%
SELF-CARE DISABILITY
0.0/ 100
METRIC RATING
338th/ 347
METRIC RANK
2.2%
SELF-CARE DISABILITY
100.0/ 100
METRIC RATING
22nd/ 347
METRIC RANK
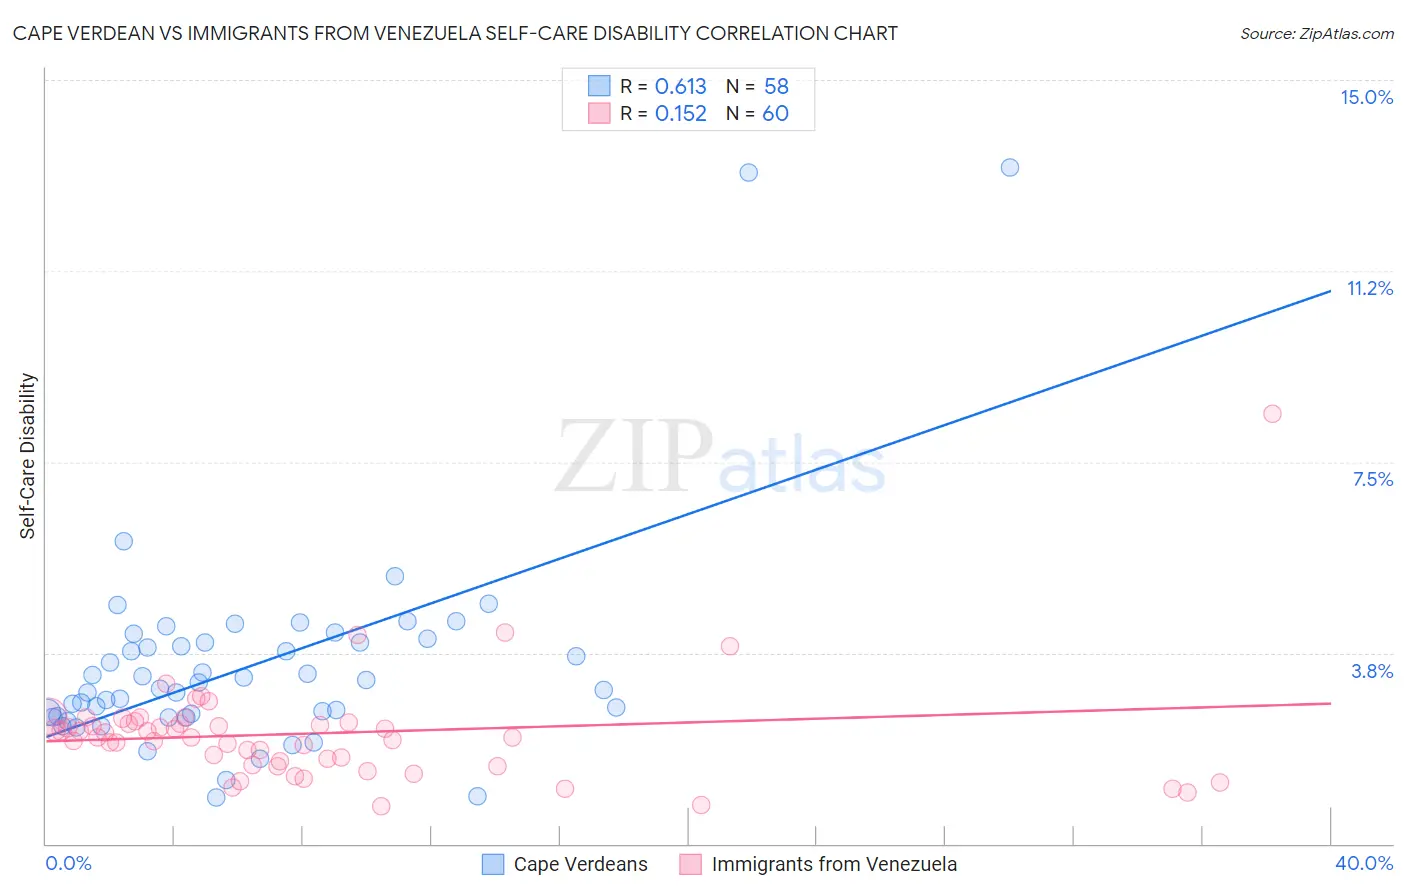
Cape Verdean vs Immigrants from Venezuela Self-Care Disability Correlation Chart
The statistical analysis conducted on geographies consisting of 107,515,486 people shows a significant positive correlation between the proportion of Cape Verdeans and percentage of population with self-care disability in the United States with a correlation coefficient (R) of 0.613 and weighted average of 3.0%. Similarly, the statistical analysis conducted on geographies consisting of 287,724,504 people shows a poor positive correlation between the proportion of Immigrants from Venezuela and percentage of population with self-care disability in the United States with a correlation coefficient (R) of 0.152 and weighted average of 2.2%, a difference of 36.1%.
Self-Care Disability Correlation Summary
| Measurement | Cape Verdean | Immigrants from Venezuela |
| Minimum | 0.90% | 0.74% |
| Maximum | 13.3% | 8.4% |
| Range | 12.4% | 7.7% |
| Mean | 3.5% | 2.2% |
| Median | 3.1% | 2.1% |
| Interquartile 25% (IQ1) | 2.5% | 1.6% |
| Interquartile 75% (IQ3) | 4.0% | 2.4% |
| Interquartile Range (IQR) | 1.5% | 0.78% |
| Standard Deviation (Sample) | 2.1% | 1.1% |
| Standard Deviation (Population) | 2.1% | 1.1% |
Similar Demographics by Self-Care Disability
Demographics Similar to Cape Verdeans by Self-Care Disability
In terms of self-care disability, the demographic groups most similar to Cape Verdeans are Choctaw (3.0%, a difference of 0.31%), Immigrants from Dominican Republic (3.0%, a difference of 0.38%), Immigrants from Cabo Verde (3.1%, a difference of 0.72%), Dominican (3.1%, a difference of 0.98%), and Immigrants from Yemen (3.0%, a difference of 1.4%).
| Demographics | Rating | Rank | Self-Care Disability |
| Lumbee | 0.0 /100 | #331 | Tragic 3.0% |
| Kiowa | 0.0 /100 | #332 | Tragic 3.0% |
| Dutch West Indians | 0.0 /100 | #333 | Tragic 3.0% |
| Houma | 0.0 /100 | #334 | Tragic 3.0% |
| Immigrants | Azores | 0.0 /100 | #335 | Tragic 3.0% |
| Immigrants | Yemen | 0.0 /100 | #336 | Tragic 3.0% |
| Choctaw | 0.0 /100 | #337 | Tragic 3.0% |
| Cape Verdeans | 0.0 /100 | #338 | Tragic 3.0% |
| Immigrants | Dominican Republic | 0.0 /100 | #339 | Tragic 3.0% |
| Immigrants | Cabo Verde | 0.0 /100 | #340 | Tragic 3.1% |
| Dominicans | 0.0 /100 | #341 | Tragic 3.1% |
| Colville | 0.0 /100 | #342 | Tragic 3.1% |
| Tohono O'odham | 0.0 /100 | #343 | Tragic 3.1% |
| Pueblo | 0.0 /100 | #344 | Tragic 3.3% |
| Armenians | 0.0 /100 | #345 | Tragic 3.4% |
Demographics Similar to Immigrants from Venezuela by Self-Care Disability
In terms of self-care disability, the demographic groups most similar to Immigrants from Venezuela are Bulgarian (2.2%, a difference of 0.040%), Cambodian (2.2%, a difference of 0.21%), Tongan (2.2%, a difference of 0.29%), Immigrants from Eritrea (2.2%, a difference of 0.36%), and Cypriot (2.2%, a difference of 0.52%).
| Demographics | Rating | Rank | Self-Care Disability |
| Okinawans | 100.0 /100 | #15 | Exceptional 2.2% |
| Immigrants | Kuwait | 100.0 /100 | #16 | Exceptional 2.2% |
| Immigrants | Saudi Arabia | 100.0 /100 | #17 | Exceptional 2.2% |
| Immigrants | Taiwan | 100.0 /100 | #18 | Exceptional 2.2% |
| Immigrants | Eritrea | 100.0 /100 | #19 | Exceptional 2.2% |
| Tongans | 100.0 /100 | #20 | Exceptional 2.2% |
| Bulgarians | 100.0 /100 | #21 | Exceptional 2.2% |
| Immigrants | Venezuela | 100.0 /100 | #22 | Exceptional 2.2% |
| Cambodians | 100.0 /100 | #23 | Exceptional 2.2% |
| Cypriots | 100.0 /100 | #24 | Exceptional 2.2% |
| Turks | 100.0 /100 | #25 | Exceptional 2.2% |
| Immigrants | Sri Lanka | 99.9 /100 | #26 | Exceptional 2.2% |
| Venezuelans | 99.9 /100 | #27 | Exceptional 2.2% |
| Inupiat | 99.9 /100 | #28 | Exceptional 2.2% |
| Immigrants | Zimbabwe | 99.9 /100 | #29 | Exceptional 2.3% |