Apache vs Immigrants from Costa Rica Ambulatory Disability
COMPARE
Apache
Immigrants from Costa Rica
Ambulatory Disability
Ambulatory Disability Comparison
Apache
Immigrants from Costa Rica
7.4%
AMBULATORY DISABILITY
0.0/ 100
METRIC RATING
321st/ 347
METRIC RANK
5.9%
AMBULATORY DISABILITY
89.5/ 100
METRIC RATING
131st/ 347
METRIC RANK
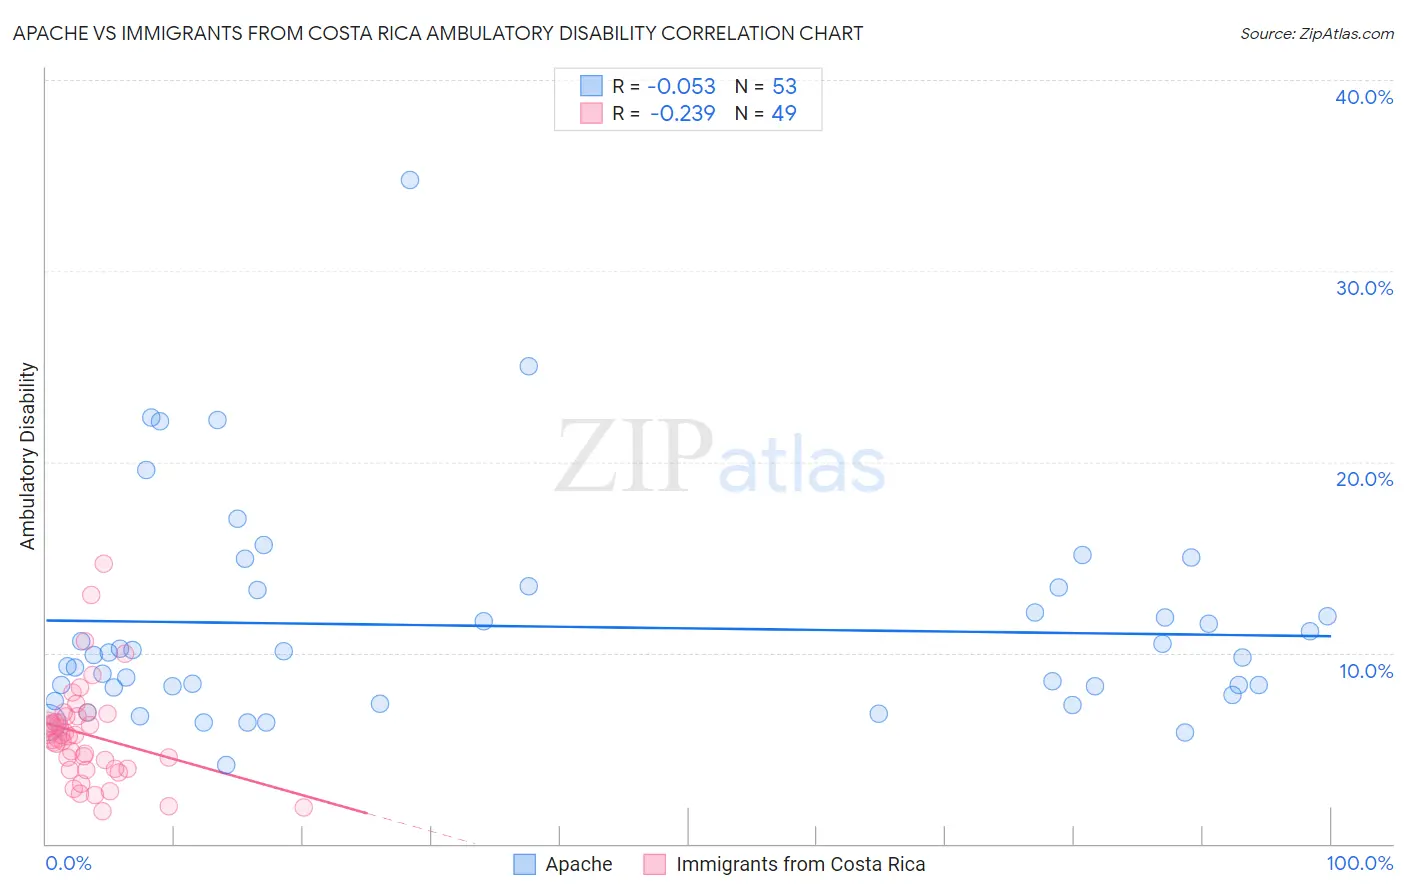
Apache vs Immigrants from Costa Rica Ambulatory Disability Correlation Chart
The statistical analysis conducted on geographies consisting of 231,047,475 people shows a slight negative correlation between the proportion of Apache and percentage of population with ambulatory disability in the United States with a correlation coefficient (R) of -0.053 and weighted average of 7.4%. Similarly, the statistical analysis conducted on geographies consisting of 204,267,937 people shows a weak negative correlation between the proportion of Immigrants from Costa Rica and percentage of population with ambulatory disability in the United States with a correlation coefficient (R) of -0.239 and weighted average of 5.9%, a difference of 24.1%.
Ambulatory Disability Correlation Summary
| Measurement | Apache | Immigrants from Costa Rica |
| Minimum | 4.1% | 1.7% |
| Maximum | 34.8% | 14.6% |
| Range | 30.7% | 13.0% |
| Mean | 11.4% | 5.7% |
| Median | 9.9% | 5.6% |
| Interquartile 25% (IQ1) | 8.0% | 4.0% |
| Interquartile 75% (IQ3) | 13.4% | 6.7% |
| Interquartile Range (IQR) | 5.4% | 2.8% |
| Standard Deviation (Sample) | 5.7% | 2.6% |
| Standard Deviation (Population) | 5.6% | 2.6% |
Similar Demographics by Ambulatory Disability
Demographics Similar to Apache by Ambulatory Disability
In terms of ambulatory disability, the demographic groups most similar to Apache are Osage (7.4%, a difference of 0.14%), American (7.4%, a difference of 0.42%), Potawatomi (7.3%, a difference of 0.81%), Navajo (7.5%, a difference of 1.7%), and Comanche (7.5%, a difference of 1.8%).
| Demographics | Rating | Rank | Ambulatory Disability |
| Blackfeet | 0.0 /100 | #314 | Tragic 7.1% |
| Shoshone | 0.0 /100 | #315 | Tragic 7.1% |
| Immigrants | Dominican Republic | 0.0 /100 | #316 | Tragic 7.1% |
| Central American Indians | 0.0 /100 | #317 | Tragic 7.2% |
| Ottawa | 0.0 /100 | #318 | Tragic 7.2% |
| Dominicans | 0.0 /100 | #319 | Tragic 7.2% |
| Potawatomi | 0.0 /100 | #320 | Tragic 7.3% |
| Apache | 0.0 /100 | #321 | Tragic 7.4% |
| Osage | 0.0 /100 | #322 | Tragic 7.4% |
| Americans | 0.0 /100 | #323 | Tragic 7.4% |
| Navajo | 0.0 /100 | #324 | Tragic 7.5% |
| Comanche | 0.0 /100 | #325 | Tragic 7.5% |
| Blacks/African Americans | 0.0 /100 | #326 | Tragic 7.5% |
| Natives/Alaskans | 0.0 /100 | #327 | Tragic 7.5% |
| Hopi | 0.0 /100 | #328 | Tragic 7.6% |
Demographics Similar to Immigrants from Costa Rica by Ambulatory Disability
In terms of ambulatory disability, the demographic groups most similar to Immigrants from Costa Rica are Immigrants from Kazakhstan (5.9%, a difference of 0.030%), Immigrants from Norway (5.9%, a difference of 0.14%), Immigrants from Western Asia (5.9%, a difference of 0.17%), Immigrants from Nigeria (5.9%, a difference of 0.21%), and Immigrants from Europe (6.0%, a difference of 0.24%).
| Demographics | Rating | Rank | Ambulatory Disability |
| Immigrants | Middle Africa | 92.2 /100 | #124 | Exceptional 5.9% |
| Koreans | 91.6 /100 | #125 | Exceptional 5.9% |
| Arabs | 91.5 /100 | #126 | Exceptional 5.9% |
| Immigrants | Nigeria | 90.9 /100 | #127 | Exceptional 5.9% |
| Immigrants | Western Asia | 90.7 /100 | #128 | Exceptional 5.9% |
| Immigrants | Norway | 90.5 /100 | #129 | Exceptional 5.9% |
| Immigrants | Kazakhstan | 89.7 /100 | #130 | Excellent 5.9% |
| Immigrants | Costa Rica | 89.5 /100 | #131 | Excellent 5.9% |
| Immigrants | Europe | 87.8 /100 | #132 | Excellent 6.0% |
| Immigrants | Immigrants | 86.9 /100 | #133 | Excellent 6.0% |
| Ute | 86.6 /100 | #134 | Excellent 6.0% |
| Immigrants | Italy | 85.0 /100 | #135 | Excellent 6.0% |
| Immigrants | North Macedonia | 84.1 /100 | #136 | Excellent 6.0% |
| Immigrants | Syria | 84.1 /100 | #137 | Excellent 6.0% |
| Immigrants | Hungary | 83.9 /100 | #138 | Excellent 6.0% |