Apache vs Native Hawaiian Ambulatory Disability
COMPARE
Apache
Native Hawaiian
Ambulatory Disability
Ambulatory Disability Comparison
Apache
Native Hawaiians
7.4%
AMBULATORY DISABILITY
0.0/ 100
METRIC RATING
321st/ 347
METRIC RANK
6.5%
AMBULATORY DISABILITY
1.1/ 100
METRIC RATING
249th/ 347
METRIC RANK
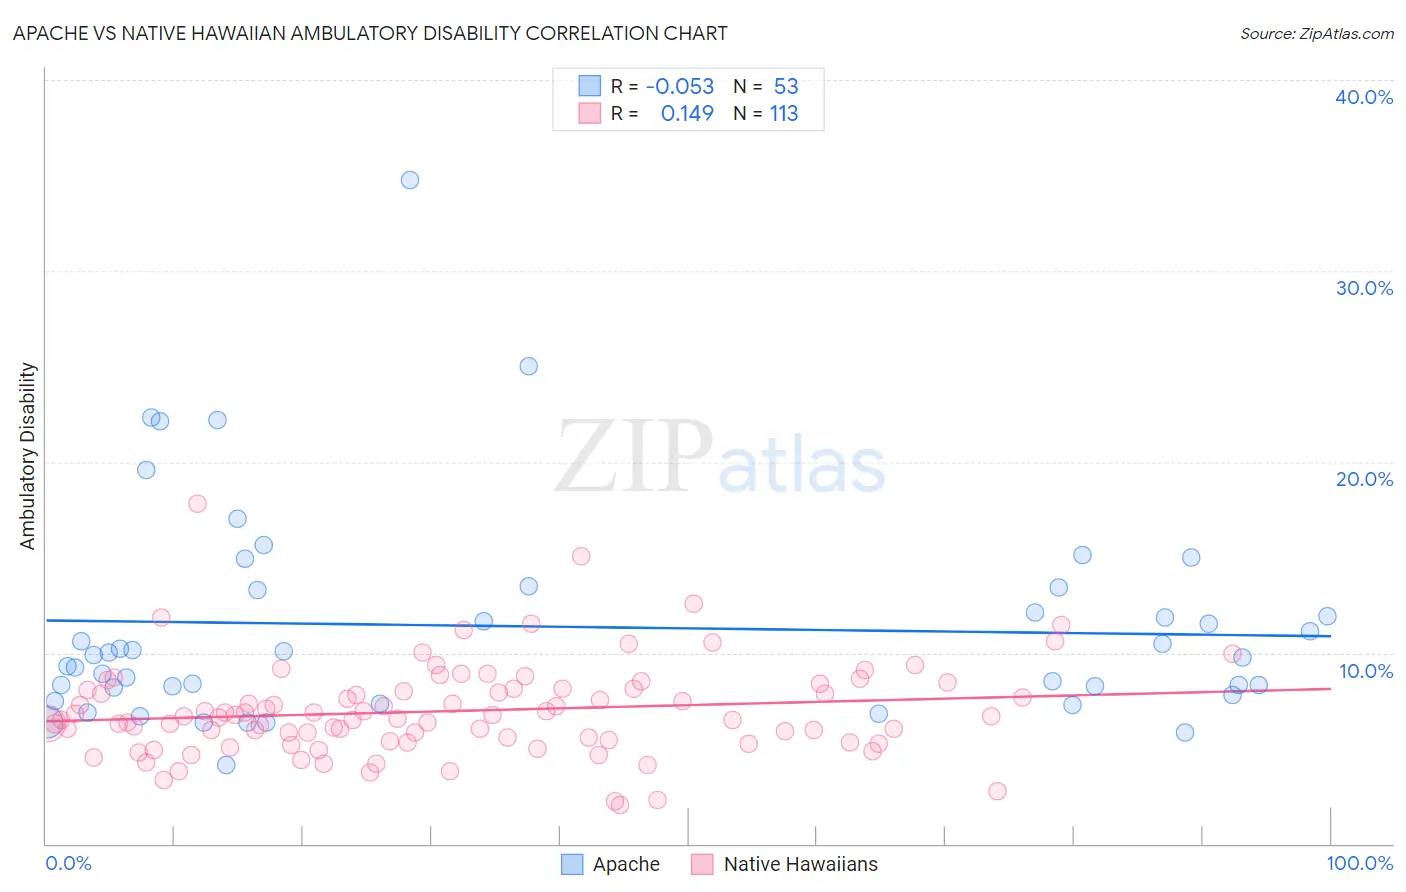
Apache vs Native Hawaiian Ambulatory Disability Correlation Chart
The statistical analysis conducted on geographies consisting of 231,047,475 people shows a slight negative correlation between the proportion of Apache and percentage of population with ambulatory disability in the United States with a correlation coefficient (R) of -0.053 and weighted average of 7.4%. Similarly, the statistical analysis conducted on geographies consisting of 331,921,721 people shows a poor positive correlation between the proportion of Native Hawaiians and percentage of population with ambulatory disability in the United States with a correlation coefficient (R) of 0.149 and weighted average of 6.5%, a difference of 13.8%.
Ambulatory Disability Correlation Summary
| Measurement | Apache | Native Hawaiian |
| Minimum | 4.1% | 2.0% |
| Maximum | 34.8% | 17.8% |
| Range | 30.7% | 15.8% |
| Mean | 11.4% | 6.9% |
| Median | 9.9% | 6.7% |
| Interquartile 25% (IQ1) | 8.0% | 5.4% |
| Interquartile 75% (IQ3) | 13.4% | 8.1% |
| Interquartile Range (IQR) | 5.4% | 2.7% |
| Standard Deviation (Sample) | 5.7% | 2.4% |
| Standard Deviation (Population) | 5.6% | 2.4% |
Similar Demographics by Ambulatory Disability
Demographics Similar to Apache by Ambulatory Disability
In terms of ambulatory disability, the demographic groups most similar to Apache are Osage (7.4%, a difference of 0.14%), American (7.4%, a difference of 0.42%), Potawatomi (7.3%, a difference of 0.81%), Navajo (7.5%, a difference of 1.7%), and Comanche (7.5%, a difference of 1.8%).
| Demographics | Rating | Rank | Ambulatory Disability |
| Blackfeet | 0.0 /100 | #314 | Tragic 7.1% |
| Shoshone | 0.0 /100 | #315 | Tragic 7.1% |
| Immigrants | Dominican Republic | 0.0 /100 | #316 | Tragic 7.1% |
| Central American Indians | 0.0 /100 | #317 | Tragic 7.2% |
| Ottawa | 0.0 /100 | #318 | Tragic 7.2% |
| Dominicans | 0.0 /100 | #319 | Tragic 7.2% |
| Potawatomi | 0.0 /100 | #320 | Tragic 7.3% |
| Apache | 0.0 /100 | #321 | Tragic 7.4% |
| Osage | 0.0 /100 | #322 | Tragic 7.4% |
| Americans | 0.0 /100 | #323 | Tragic 7.4% |
| Navajo | 0.0 /100 | #324 | Tragic 7.5% |
| Comanche | 0.0 /100 | #325 | Tragic 7.5% |
| Blacks/African Americans | 0.0 /100 | #326 | Tragic 7.5% |
| Natives/Alaskans | 0.0 /100 | #327 | Tragic 7.5% |
| Hopi | 0.0 /100 | #328 | Tragic 7.6% |
Demographics Similar to Native Hawaiians by Ambulatory Disability
In terms of ambulatory disability, the demographic groups most similar to Native Hawaiians are Chinese (6.5%, a difference of 0.080%), Hawaiian (6.5%, a difference of 0.26%), Immigrants from Portugal (6.5%, a difference of 0.28%), Immigrants from Cuba (6.5%, a difference of 0.30%), and Armenian (6.5%, a difference of 0.36%).
| Demographics | Rating | Rank | Ambulatory Disability |
| Spaniards | 1.6 /100 | #242 | Tragic 6.5% |
| Germans | 1.5 /100 | #243 | Tragic 6.5% |
| Immigrants | Panama | 1.5 /100 | #244 | Tragic 6.5% |
| Tlingit-Haida | 1.5 /100 | #245 | Tragic 6.5% |
| Armenians | 1.5 /100 | #246 | Tragic 6.5% |
| Immigrants | Cuba | 1.4 /100 | #247 | Tragic 6.5% |
| Immigrants | Portugal | 1.4 /100 | #248 | Tragic 6.5% |
| Native Hawaiians | 1.1 /100 | #249 | Tragic 6.5% |
| Chinese | 1.0 /100 | #250 | Tragic 6.5% |
| Hawaiians | 0.9 /100 | #251 | Tragic 6.5% |
| Immigrants | Bahamas | 0.8 /100 | #252 | Tragic 6.5% |
| Scottish | 0.7 /100 | #253 | Tragic 6.5% |
| Belizeans | 0.7 /100 | #254 | Tragic 6.5% |
| Welsh | 0.6 /100 | #255 | Tragic 6.5% |
| Immigrants | Uzbekistan | 0.6 /100 | #256 | Tragic 6.5% |