American vs Welsh Disability Age 5 to 17
COMPARE
American
Welsh
Disability Age 5 to 17
Disability Age 5 to 17 Comparison
Americans
Welsh
6.5%
DISABILITY AGE 5 TO 17
0.0/ 100
METRIC RATING
325th/ 347
METRIC RANK
6.3%
DISABILITY AGE 5 TO 17
0.0/ 100
METRIC RATING
299th/ 347
METRIC RANK
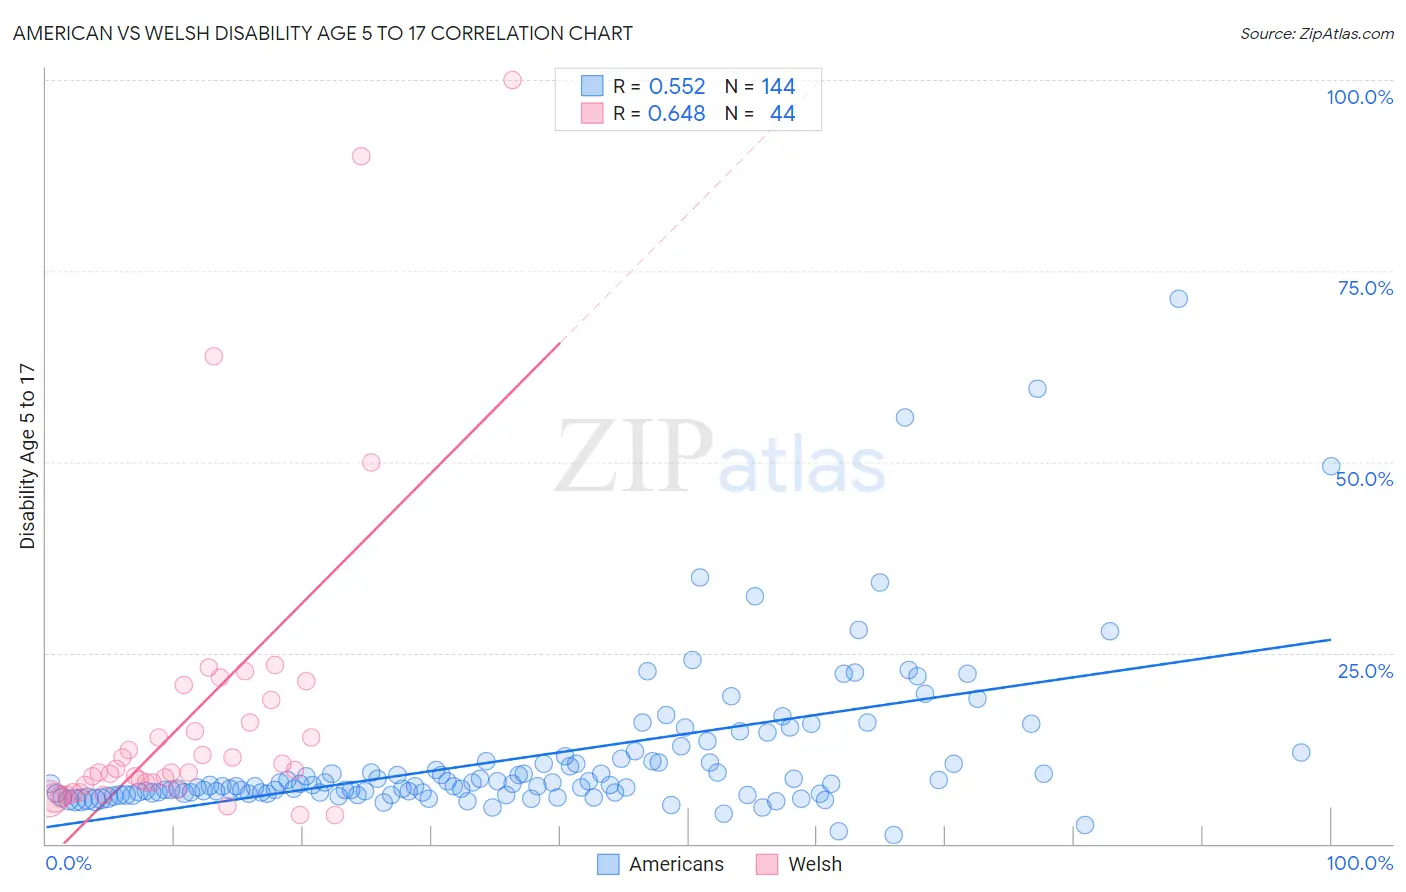
American vs Welsh Disability Age 5 to 17 Correlation Chart
The statistical analysis conducted on geographies consisting of 566,133,165 people shows a substantial positive correlation between the proportion of Americans and percentage of population with a disability between the ages 5 and 17 in the United States with a correlation coefficient (R) of 0.552 and weighted average of 6.5%. Similarly, the statistical analysis conducted on geographies consisting of 518,817,158 people shows a significant positive correlation between the proportion of Welsh and percentage of population with a disability between the ages 5 and 17 in the United States with a correlation coefficient (R) of 0.648 and weighted average of 6.3%, a difference of 4.3%.
Disability Age 5 to 17 Correlation Summary
| Measurement | American | Welsh |
| Minimum | 1.2% | 3.7% |
| Maximum | 71.4% | 100.0% |
| Range | 70.2% | 96.3% |
| Mean | 11.3% | 17.0% |
| Median | 7.7% | 9.5% |
| Interquartile 25% (IQ1) | 6.6% | 7.4% |
| Interquartile 75% (IQ3) | 10.8% | 17.4% |
| Interquartile Range (IQR) | 4.2% | 9.9% |
| Standard Deviation (Sample) | 10.2% | 20.5% |
| Standard Deviation (Population) | 10.2% | 20.3% |
Similar Demographics by Disability Age 5 to 17
Demographics Similar to Americans by Disability Age 5 to 17
In terms of disability age 5 to 17, the demographic groups most similar to Americans are Dominican (6.5%, a difference of 0.050%), Potawatomi (6.5%, a difference of 0.13%), Osage (6.5%, a difference of 0.14%), Slovak (6.5%, a difference of 0.17%), and Tohono O'odham (6.5%, a difference of 0.19%).
| Demographics | Rating | Rank | Disability Age 5 to 17 |
| Comanche | 0.0 /100 | #318 | Tragic 6.4% |
| Delaware | 0.0 /100 | #319 | Tragic 6.5% |
| Africans | 0.0 /100 | #320 | Tragic 6.5% |
| Tohono O'odham | 0.0 /100 | #321 | Tragic 6.5% |
| Slovaks | 0.0 /100 | #322 | Tragic 6.5% |
| Osage | 0.0 /100 | #323 | Tragic 6.5% |
| Dominicans | 0.0 /100 | #324 | Tragic 6.5% |
| Americans | 0.0 /100 | #325 | Tragic 6.5% |
| Potawatomi | 0.0 /100 | #326 | Tragic 6.5% |
| French American Indians | 0.0 /100 | #327 | Tragic 6.6% |
| Pennsylvania Germans | 0.0 /100 | #328 | Tragic 6.6% |
| Blackfeet | 0.0 /100 | #329 | Tragic 6.6% |
| Dutch West Indians | 0.0 /100 | #330 | Tragic 6.7% |
| French Canadians | 0.0 /100 | #331 | Tragic 6.7% |
| Immigrants | Azores | 0.0 /100 | #332 | Tragic 6.7% |
Demographics Similar to Welsh by Disability Age 5 to 17
In terms of disability age 5 to 17, the demographic groups most similar to Welsh are Carpatho Rusyn (6.3%, a difference of 0.12%), U.S. Virgin Islander (6.3%, a difference of 0.14%), Lumbee (6.2%, a difference of 0.15%), Immigrants from Bahamas (6.2%, a difference of 0.22%), and Spanish American (6.2%, a difference of 0.35%).
| Demographics | Rating | Rank | Disability Age 5 to 17 |
| Immigrants | Senegal | 0.0 /100 | #292 | Tragic 6.2% |
| Central American Indians | 0.0 /100 | #293 | Tragic 6.2% |
| Irish | 0.0 /100 | #294 | Tragic 6.2% |
| Cree | 0.0 /100 | #295 | Tragic 6.2% |
| Spanish Americans | 0.0 /100 | #296 | Tragic 6.2% |
| Immigrants | Bahamas | 0.0 /100 | #297 | Tragic 6.2% |
| Lumbee | 0.0 /100 | #298 | Tragic 6.2% |
| Welsh | 0.0 /100 | #299 | Tragic 6.3% |
| Carpatho Rusyns | 0.0 /100 | #300 | Tragic 6.3% |
| U.S. Virgin Islanders | 0.0 /100 | #301 | Tragic 6.3% |
| Celtics | 0.0 /100 | #302 | Tragic 6.3% |
| Yakama | 0.0 /100 | #303 | Tragic 6.3% |
| Senegalese | 0.0 /100 | #304 | Tragic 6.3% |
| Natives/Alaskans | 0.0 /100 | #305 | Tragic 6.3% |
| Immigrants | Nonimmigrants | 0.0 /100 | #306 | Tragic 6.3% |