American vs Welsh 2nd Grade
COMPARE
American
Welsh
2nd Grade
2nd Grade Comparison
Americans
Welsh
98.3%
2ND GRADE
99.8/ 100
METRIC RATING
56th/ 347
METRIC RANK
98.5%
2ND GRADE
100.0/ 100
METRIC RATING
26th/ 347
METRIC RANK
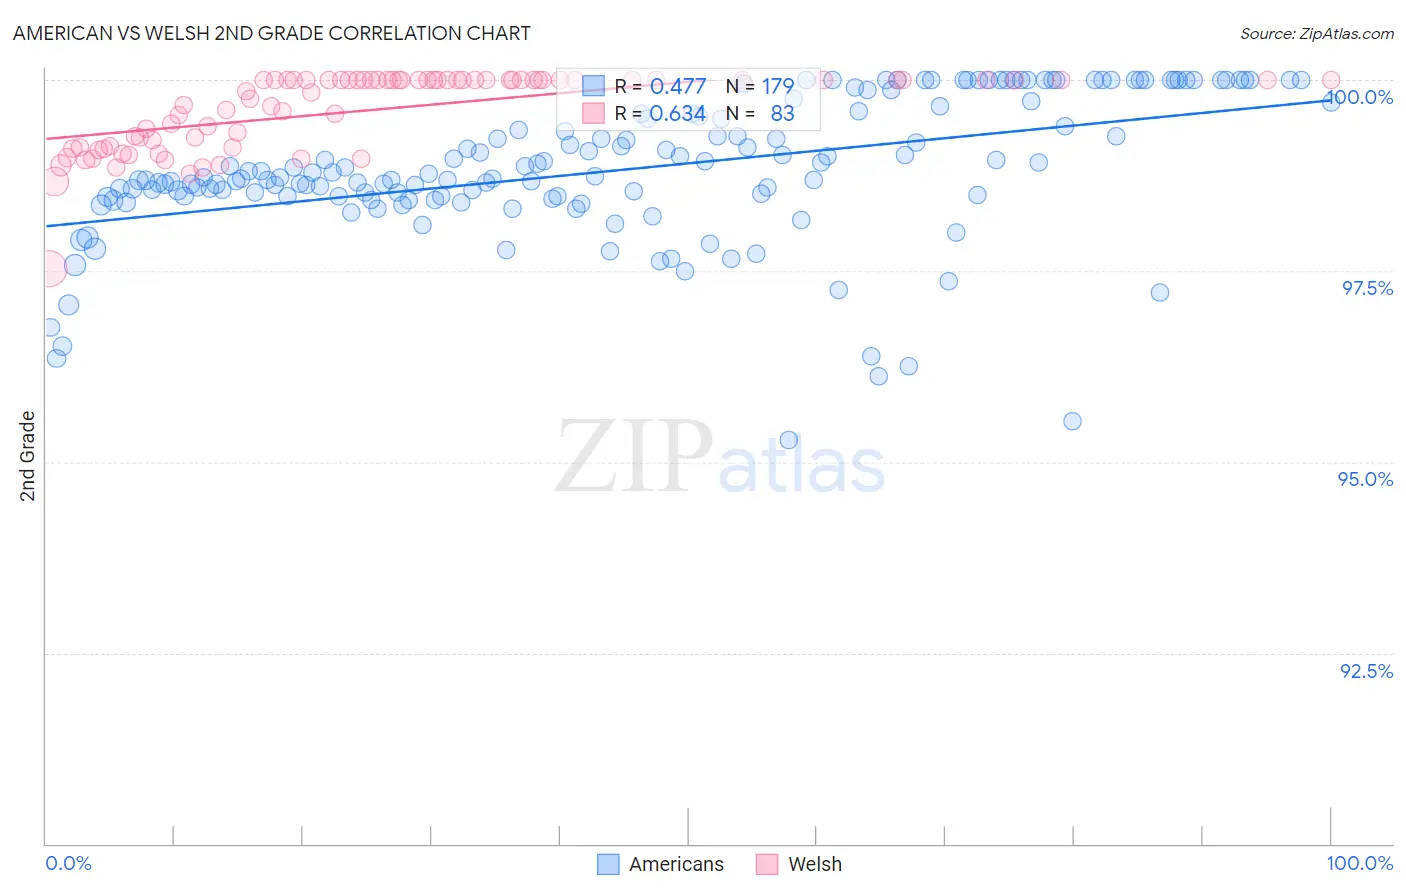
American vs Welsh 2nd Grade Correlation Chart
The statistical analysis conducted on geographies consisting of 581,990,776 people shows a moderate positive correlation between the proportion of Americans and percentage of population with at least 2nd grade education in the United States with a correlation coefficient (R) of 0.477 and weighted average of 98.3%. Similarly, the statistical analysis conducted on geographies consisting of 528,593,932 people shows a significant positive correlation between the proportion of Welsh and percentage of population with at least 2nd grade education in the United States with a correlation coefficient (R) of 0.634 and weighted average of 98.5%, a difference of 0.19%.
2nd Grade Correlation Summary
| Measurement | American | Welsh |
| Minimum | 95.3% | 97.5% |
| Maximum | 100.0% | 100.0% |
| Range | 4.7% | 2.5% |
| Mean | 98.8% | 99.6% |
| Median | 98.7% | 100.0% |
| Interquartile 25% (IQ1) | 98.5% | 99.1% |
| Interquartile 75% (IQ3) | 99.6% | 100.0% |
| Interquartile Range (IQR) | 1.1% | 0.88% |
| Standard Deviation (Sample) | 0.93% | 0.50% |
| Standard Deviation (Population) | 0.93% | 0.50% |
Similar Demographics by 2nd Grade
Demographics Similar to Americans by 2nd Grade
In terms of 2nd grade, the demographic groups most similar to Americans are Austrian (98.3%, a difference of 0.0%), Bulgarian (98.3%, a difference of 0.0%), Pueblo (98.3%, a difference of 0.010%), Kiowa (98.3%, a difference of 0.010%), and Immigrants from Scotland (98.3%, a difference of 0.010%).
| Demographics | Rating | Rank | 2nd Grade |
| Celtics | 99.8 /100 | #49 | Exceptional 98.4% |
| Whites/Caucasians | 99.8 /100 | #50 | Exceptional 98.4% |
| Estonians | 99.8 /100 | #51 | Exceptional 98.4% |
| Australians | 99.8 /100 | #52 | Exceptional 98.4% |
| Pueblo | 99.8 /100 | #53 | Exceptional 98.3% |
| Kiowa | 99.8 /100 | #54 | Exceptional 98.3% |
| Immigrants | Scotland | 99.8 /100 | #55 | Exceptional 98.3% |
| Americans | 99.8 /100 | #56 | Exceptional 98.3% |
| Austrians | 99.8 /100 | #57 | Exceptional 98.3% |
| Bulgarians | 99.8 /100 | #58 | Exceptional 98.3% |
| Slavs | 99.8 /100 | #59 | Exceptional 98.3% |
| Creek | 99.8 /100 | #60 | Exceptional 98.3% |
| Immigrants | Canada | 99.8 /100 | #61 | Exceptional 98.3% |
| Greeks | 99.8 /100 | #62 | Exceptional 98.3% |
| Maltese | 99.7 /100 | #63 | Exceptional 98.3% |
Demographics Similar to Welsh by 2nd Grade
In terms of 2nd grade, the demographic groups most similar to Welsh are Scotch-Irish (98.5%, a difference of 0.010%), Croatian (98.5%, a difference of 0.010%), Arapaho (98.5%, a difference of 0.010%), French (98.5%, a difference of 0.010%), and Finnish (98.5%, a difference of 0.020%).
| Demographics | Rating | Rank | 2nd Grade |
| Finns | 100.0 /100 | #19 | Exceptional 98.5% |
| Sioux | 100.0 /100 | #20 | Exceptional 98.5% |
| Lithuanians | 100.0 /100 | #21 | Exceptional 98.5% |
| Poles | 100.0 /100 | #22 | Exceptional 98.5% |
| Danes | 100.0 /100 | #23 | Exceptional 98.5% |
| Pennsylvania Germans | 100.0 /100 | #24 | Exceptional 98.5% |
| Scotch-Irish | 100.0 /100 | #25 | Exceptional 98.5% |
| Welsh | 100.0 /100 | #26 | Exceptional 98.5% |
| Croatians | 100.0 /100 | #27 | Exceptional 98.5% |
| Arapaho | 100.0 /100 | #28 | Exceptional 98.5% |
| French | 100.0 /100 | #29 | Exceptional 98.5% |
| Europeans | 100.0 /100 | #30 | Exceptional 98.5% |
| Czechs | 100.0 /100 | #31 | Exceptional 98.5% |
| French Canadians | 100.0 /100 | #32 | Exceptional 98.5% |
| Scandinavians | 100.0 /100 | #33 | Exceptional 98.5% |