Alsatian vs Czechoslovakian Ambulatory Disability
COMPARE
Alsatian
Czechoslovakian
Ambulatory Disability
Ambulatory Disability Comparison
Alsatians
Czechoslovakians
6.3%
AMBULATORY DISABILITY
15.1/ 100
METRIC RATING
207th/ 347
METRIC RANK
6.4%
AMBULATORY DISABILITY
3.8/ 100
METRIC RATING
229th/ 347
METRIC RANK
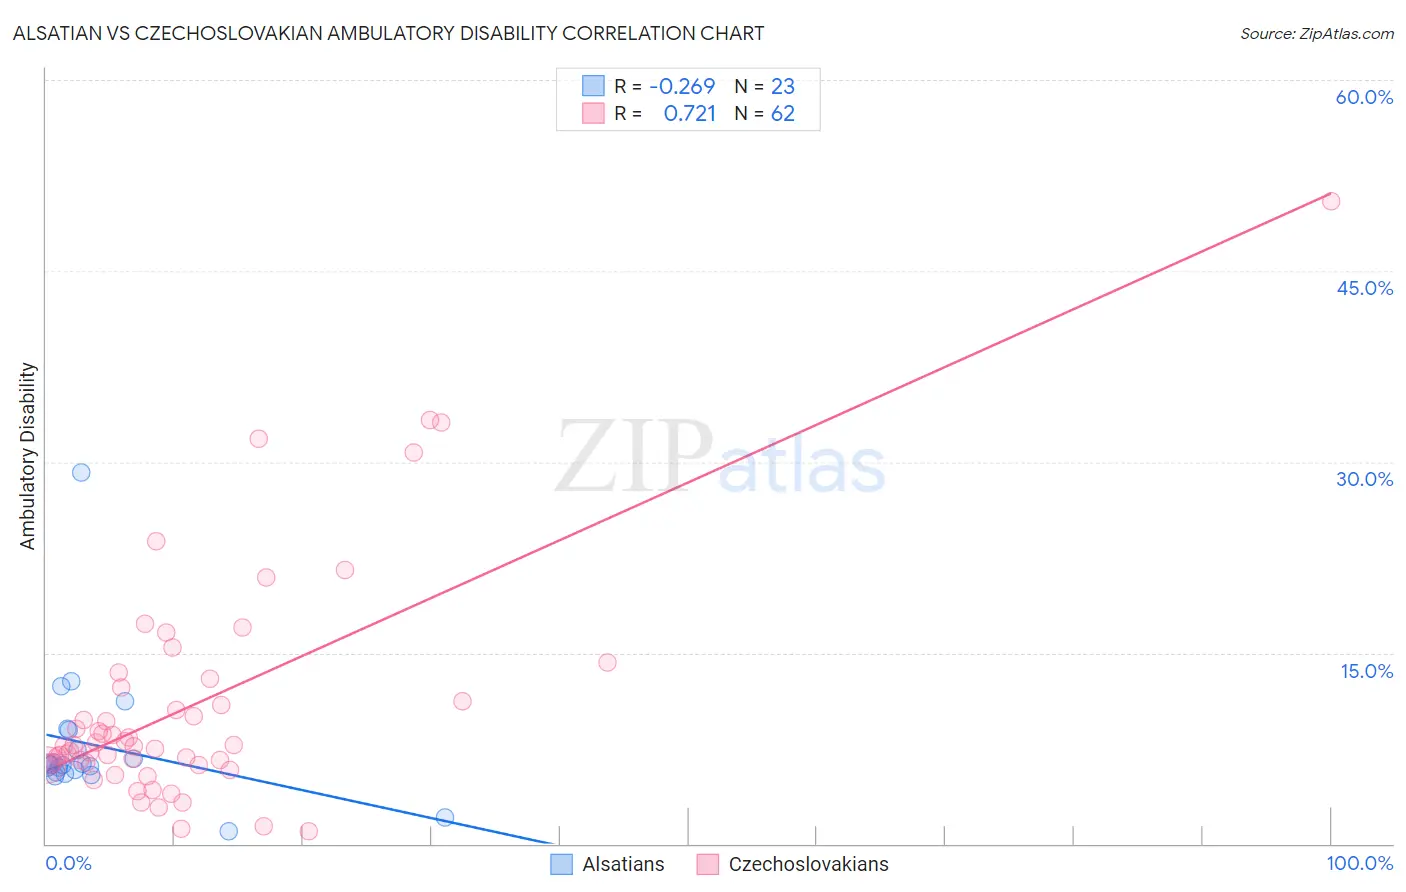
Alsatian vs Czechoslovakian Ambulatory Disability Correlation Chart
The statistical analysis conducted on geographies consisting of 82,679,981 people shows a weak negative correlation between the proportion of Alsatians and percentage of population with ambulatory disability in the United States with a correlation coefficient (R) of -0.269 and weighted average of 6.3%. Similarly, the statistical analysis conducted on geographies consisting of 368,636,980 people shows a strong positive correlation between the proportion of Czechoslovakians and percentage of population with ambulatory disability in the United States with a correlation coefficient (R) of 0.721 and weighted average of 6.4%, a difference of 1.9%.
Ambulatory Disability Correlation Summary
| Measurement | Alsatian | Czechoslovakian |
| Minimum | 0.97% | 0.94% |
| Maximum | 29.2% | 50.5% |
| Range | 28.2% | 49.6% |
| Mean | 7.7% | 10.8% |
| Median | 6.2% | 7.7% |
| Interquartile 25% (IQ1) | 5.6% | 6.3% |
| Interquartile 75% (IQ3) | 9.0% | 12.3% |
| Interquartile Range (IQR) | 3.4% | 6.0% |
| Standard Deviation (Sample) | 5.4% | 9.1% |
| Standard Deviation (Population) | 5.3% | 9.0% |
Similar Demographics by Ambulatory Disability
Demographics Similar to Alsatians by Ambulatory Disability
In terms of ambulatory disability, the demographic groups most similar to Alsatians are Bangladeshi (6.3%, a difference of 0.090%), Immigrants from Iraq (6.3%, a difference of 0.11%), Immigrants from Laos (6.3%, a difference of 0.19%), Finnish (6.2%, a difference of 0.21%), and Slovene (6.2%, a difference of 0.28%).
| Demographics | Rating | Rank | Ambulatory Disability |
| Immigrants | Cambodia | 21.5 /100 | #200 | Fair 6.2% |
| Immigrants | Central America | 20.1 /100 | #201 | Fair 6.2% |
| Albanians | 19.7 /100 | #202 | Poor 6.2% |
| Immigrants | Ukraine | 18.4 /100 | #203 | Poor 6.2% |
| Immigrants | Congo | 18.2 /100 | #204 | Poor 6.2% |
| Slovenes | 18.0 /100 | #205 | Poor 6.2% |
| Finns | 17.2 /100 | #206 | Poor 6.2% |
| Alsatians | 15.1 /100 | #207 | Poor 6.3% |
| Bangladeshis | 14.2 /100 | #208 | Poor 6.3% |
| Immigrants | Iraq | 14.0 /100 | #209 | Poor 6.3% |
| Immigrants | Laos | 13.2 /100 | #210 | Poor 6.3% |
| Samoans | 12.1 /100 | #211 | Poor 6.3% |
| Mexican American Indians | 12.0 /100 | #212 | Poor 6.3% |
| Japanese | 12.0 /100 | #213 | Poor 6.3% |
| Immigrants | Mexico | 11.0 /100 | #214 | Poor 6.3% |
Demographics Similar to Czechoslovakians by Ambulatory Disability
In terms of ambulatory disability, the demographic groups most similar to Czechoslovakians are Portuguese (6.4%, a difference of 0.050%), Cuban (6.4%, a difference of 0.060%), Mexican (6.4%, a difference of 0.11%), Panamanian (6.4%, a difference of 0.26%), and Slavic (6.4%, a difference of 0.39%).
| Demographics | Rating | Rank | Ambulatory Disability |
| German Russians | 9.4 /100 | #222 | Tragic 6.3% |
| Immigrants | Honduras | 7.6 /100 | #223 | Tragic 6.3% |
| Liberians | 7.1 /100 | #224 | Tragic 6.3% |
| Hondurans | 6.3 /100 | #225 | Tragic 6.3% |
| Slavs | 5.1 /100 | #226 | Tragic 6.4% |
| Cubans | 4.0 /100 | #227 | Tragic 6.4% |
| Portuguese | 4.0 /100 | #228 | Tragic 6.4% |
| Czechoslovakians | 3.8 /100 | #229 | Tragic 6.4% |
| Mexicans | 3.5 /100 | #230 | Tragic 6.4% |
| Panamanians | 3.1 /100 | #231 | Tragic 6.4% |
| Assyrians/Chaldeans/Syriacs | 2.4 /100 | #232 | Tragic 6.4% |
| Sub-Saharan Africans | 2.3 /100 | #233 | Tragic 6.4% |
| Immigrants | Liberia | 2.3 /100 | #234 | Tragic 6.4% |
| Hispanics or Latinos | 2.2 /100 | #235 | Tragic 6.4% |
| Dutch | 2.0 /100 | #236 | Tragic 6.4% |