Alsatian vs Yakama Ambulatory Disability
COMPARE
Alsatian
Yakama
Ambulatory Disability
Ambulatory Disability Comparison
Alsatians
Yakama
6.3%
AMBULATORY DISABILITY
15.1/ 100
METRIC RATING
207th/ 347
METRIC RANK
6.8%
AMBULATORY DISABILITY
0.0/ 100
METRIC RATING
286th/ 347
METRIC RANK
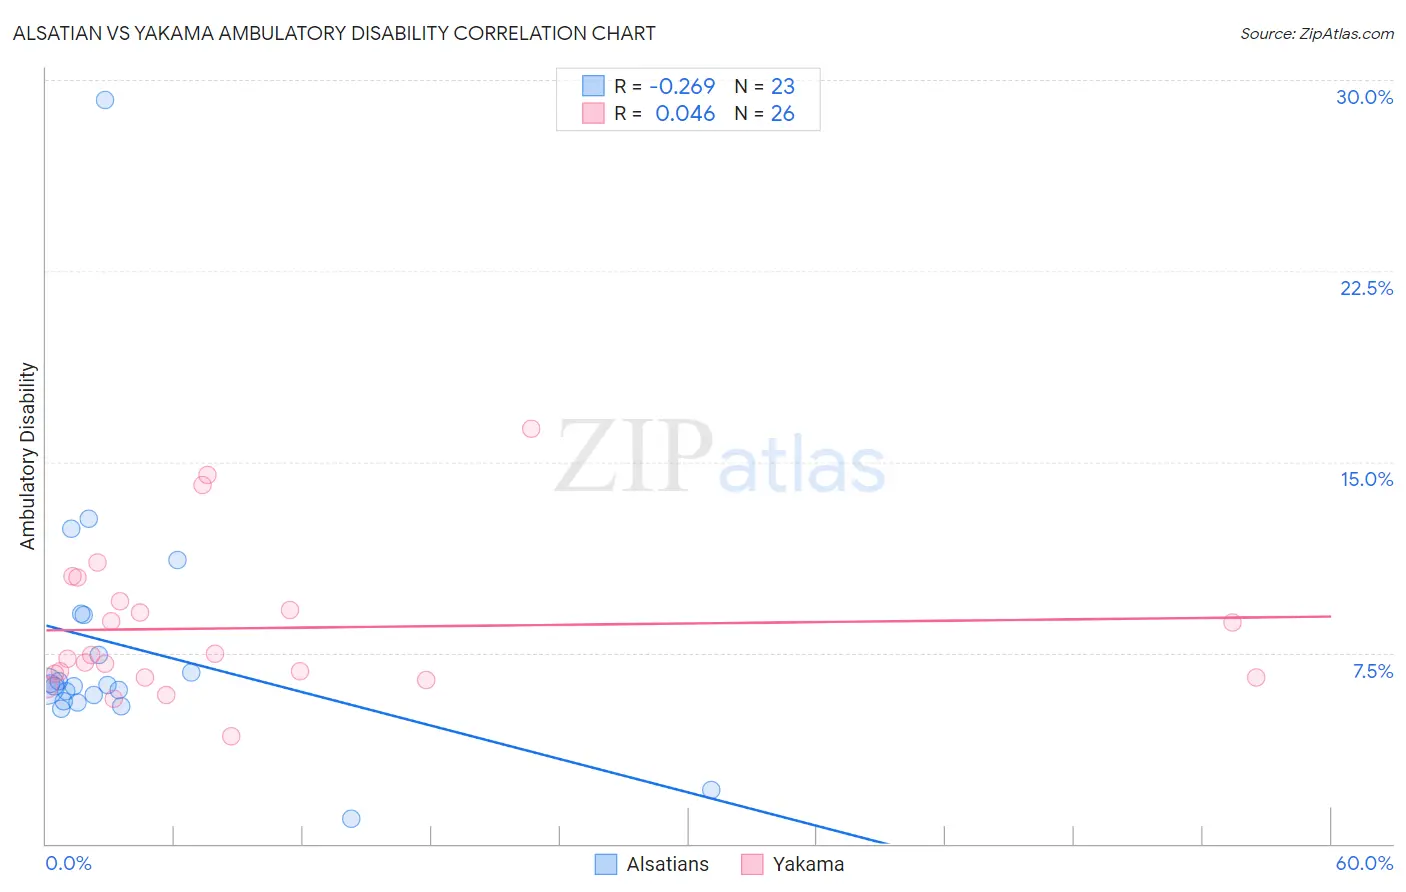
Alsatian vs Yakama Ambulatory Disability Correlation Chart
The statistical analysis conducted on geographies consisting of 82,679,981 people shows a weak negative correlation between the proportion of Alsatians and percentage of population with ambulatory disability in the United States with a correlation coefficient (R) of -0.269 and weighted average of 6.3%. Similarly, the statistical analysis conducted on geographies consisting of 19,917,759 people shows no correlation between the proportion of Yakama and percentage of population with ambulatory disability in the United States with a correlation coefficient (R) of 0.046 and weighted average of 6.8%, a difference of 8.8%.
Ambulatory Disability Correlation Summary
| Measurement | Alsatian | Yakama |
| Minimum | 0.97% | 4.2% |
| Maximum | 29.2% | 16.3% |
| Range | 28.2% | 12.0% |
| Mean | 7.7% | 8.5% |
| Median | 6.2% | 7.3% |
| Interquartile 25% (IQ1) | 5.6% | 6.5% |
| Interquartile 75% (IQ3) | 9.0% | 9.5% |
| Interquartile Range (IQR) | 3.4% | 3.0% |
| Standard Deviation (Sample) | 5.4% | 2.9% |
| Standard Deviation (Population) | 5.3% | 2.9% |
Similar Demographics by Ambulatory Disability
Demographics Similar to Alsatians by Ambulatory Disability
In terms of ambulatory disability, the demographic groups most similar to Alsatians are Bangladeshi (6.3%, a difference of 0.090%), Immigrants from Iraq (6.3%, a difference of 0.11%), Immigrants from Laos (6.3%, a difference of 0.19%), Finnish (6.2%, a difference of 0.21%), and Slovene (6.2%, a difference of 0.28%).
| Demographics | Rating | Rank | Ambulatory Disability |
| Immigrants | Cambodia | 21.5 /100 | #200 | Fair 6.2% |
| Immigrants | Central America | 20.1 /100 | #201 | Fair 6.2% |
| Albanians | 19.7 /100 | #202 | Poor 6.2% |
| Immigrants | Ukraine | 18.4 /100 | #203 | Poor 6.2% |
| Immigrants | Congo | 18.2 /100 | #204 | Poor 6.2% |
| Slovenes | 18.0 /100 | #205 | Poor 6.2% |
| Finns | 17.2 /100 | #206 | Poor 6.2% |
| Alsatians | 15.1 /100 | #207 | Poor 6.3% |
| Bangladeshis | 14.2 /100 | #208 | Poor 6.3% |
| Immigrants | Iraq | 14.0 /100 | #209 | Poor 6.3% |
| Immigrants | Laos | 13.2 /100 | #210 | Poor 6.3% |
| Samoans | 12.1 /100 | #211 | Poor 6.3% |
| Mexican American Indians | 12.0 /100 | #212 | Poor 6.3% |
| Japanese | 12.0 /100 | #213 | Poor 6.3% |
| Immigrants | Mexico | 11.0 /100 | #214 | Poor 6.3% |
Demographics Similar to Yakama by Ambulatory Disability
In terms of ambulatory disability, the demographic groups most similar to Yakama are Fijian (6.8%, a difference of 0.040%), U.S. Virgin Islander (6.8%, a difference of 0.32%), Immigrants from Jamaica (6.8%, a difference of 0.45%), Immigrants from Barbados (6.8%, a difference of 0.52%), and Nonimmigrants (6.9%, a difference of 0.60%).
| Demographics | Rating | Rank | Ambulatory Disability |
| Immigrants | Caribbean | 0.0 /100 | #279 | Tragic 6.7% |
| Pennsylvania Germans | 0.0 /100 | #280 | Tragic 6.8% |
| Yaqui | 0.0 /100 | #281 | Tragic 6.8% |
| Barbadians | 0.0 /100 | #282 | Tragic 6.8% |
| Immigrants | Barbados | 0.0 /100 | #283 | Tragic 6.8% |
| Immigrants | Jamaica | 0.0 /100 | #284 | Tragic 6.8% |
| Fijians | 0.0 /100 | #285 | Tragic 6.8% |
| Yakama | 0.0 /100 | #286 | Tragic 6.8% |
| U.S. Virgin Islanders | 0.0 /100 | #287 | Tragic 6.8% |
| Immigrants | Nonimmigrants | 0.0 /100 | #288 | Tragic 6.9% |
| Immigrants | Dominica | 0.0 /100 | #289 | Tragic 6.9% |
| Scotch-Irish | 0.0 /100 | #290 | Tragic 6.9% |
| West Indians | 0.0 /100 | #291 | Tragic 6.9% |
| Cheyenne | 0.0 /100 | #292 | Tragic 6.9% |
| Immigrants | St. Vincent and the Grenadines | 0.0 /100 | #293 | Tragic 6.9% |