Alsatian vs Czechoslovakian 5th Grade
COMPARE
Alsatian
Czechoslovakian
5th Grade
5th Grade Comparison
Alsatians
Czechoslovakians
97.4%
5TH GRADE
74.3/ 100
METRIC RATING
153rd/ 347
METRIC RANK
98.0%
5TH GRADE
99.9/ 100
METRIC RATING
45th/ 347
METRIC RANK
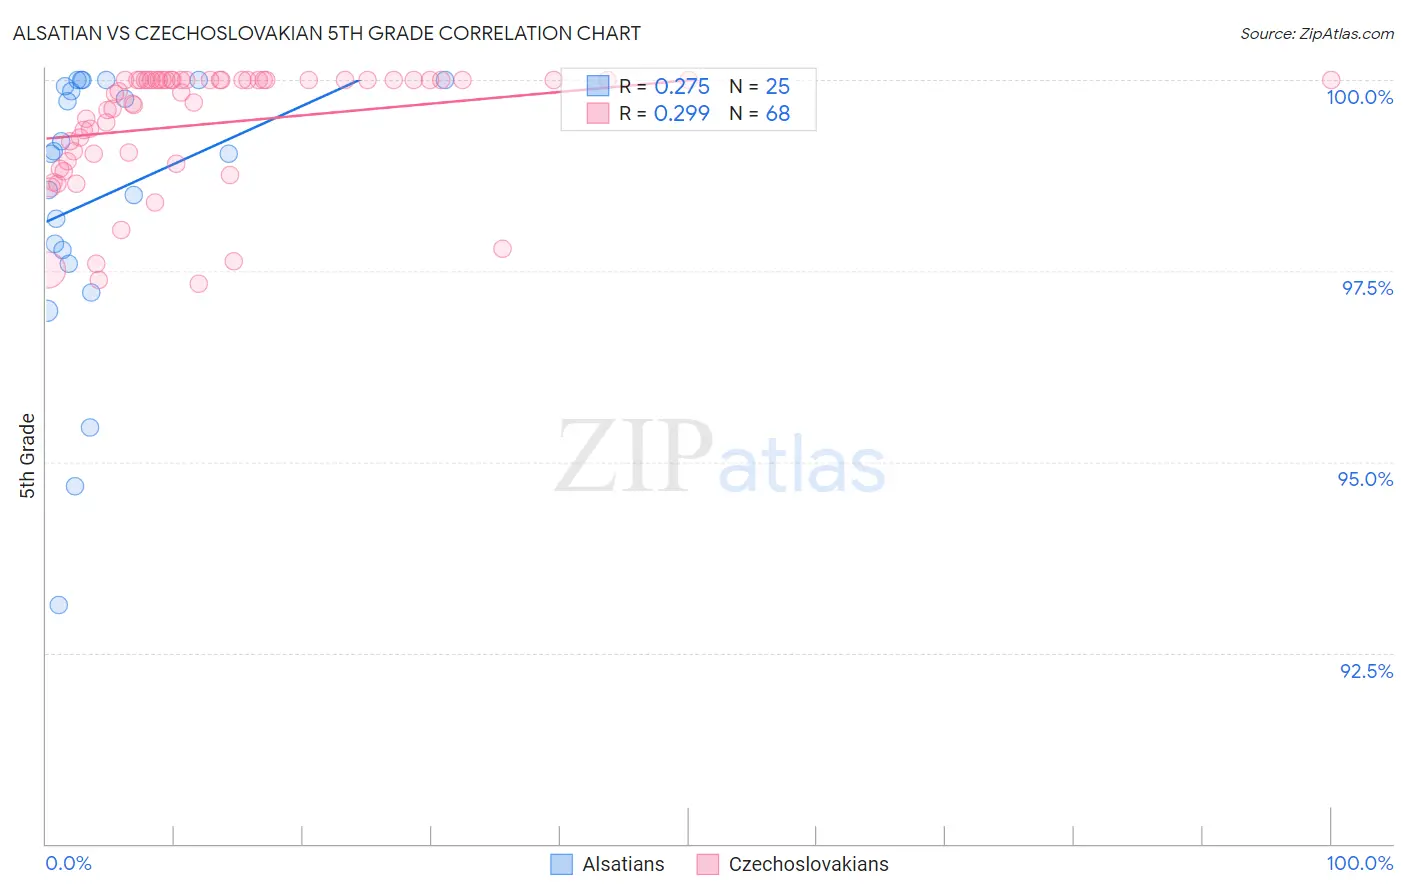
Alsatian vs Czechoslovakian 5th Grade Correlation Chart
The statistical analysis conducted on geographies consisting of 82,682,365 people shows a weak positive correlation between the proportion of Alsatians and percentage of population with at least 5th grade education in the United States with a correlation coefficient (R) of 0.275 and weighted average of 97.4%. Similarly, the statistical analysis conducted on geographies consisting of 368,657,544 people shows a weak positive correlation between the proportion of Czechoslovakians and percentage of population with at least 5th grade education in the United States with a correlation coefficient (R) of 0.299 and weighted average of 98.0%, a difference of 0.58%.
5th Grade Correlation Summary
| Measurement | Alsatian | Czechoslovakian |
| Minimum | 93.1% | 97.3% |
| Maximum | 100.0% | 100.0% |
| Range | 6.9% | 2.7% |
| Mean | 98.5% | 99.4% |
| Median | 99.0% | 99.9% |
| Interquartile 25% (IQ1) | 97.7% | 99.0% |
| Interquartile 75% (IQ3) | 100.0% | 100.0% |
| Interquartile Range (IQR) | 2.3% | 1.0% |
| Standard Deviation (Sample) | 1.8% | 0.78% |
| Standard Deviation (Population) | 1.8% | 0.78% |
Similar Demographics by 5th Grade
Demographics Similar to Alsatians by 5th Grade
In terms of 5th grade, the demographic groups most similar to Alsatians are Immigrants from Eastern Europe (97.4%, a difference of 0.0%), Ute (97.4%, a difference of 0.0%), Immigrants from South Central Asia (97.5%, a difference of 0.020%), Immigrants from Russia (97.4%, a difference of 0.020%), and Immigrants from Bosnia and Herzegovina (97.4%, a difference of 0.020%).
| Demographics | Rating | Rank | 5th Grade |
| Spaniards | 81.9 /100 | #146 | Excellent 97.5% |
| Soviet Union | 81.2 /100 | #147 | Excellent 97.5% |
| Immigrants | Israel | 79.1 /100 | #148 | Good 97.5% |
| Hopi | 78.6 /100 | #149 | Good 97.5% |
| Immigrants | South Central Asia | 78.6 /100 | #150 | Good 97.5% |
| Immigrants | Eastern Europe | 75.0 /100 | #151 | Good 97.4% |
| Ute | 74.9 /100 | #152 | Good 97.4% |
| Alsatians | 74.3 /100 | #153 | Good 97.4% |
| Immigrants | Russia | 71.2 /100 | #154 | Good 97.4% |
| Immigrants | Bosnia and Herzegovina | 71.0 /100 | #155 | Good 97.4% |
| French American Indians | 70.5 /100 | #156 | Good 97.4% |
| Immigrants | Jordan | 70.4 /100 | #157 | Good 97.4% |
| Albanians | 68.3 /100 | #158 | Good 97.4% |
| Immigrants | Italy | 65.2 /100 | #159 | Good 97.4% |
| Marshallese | 61.2 /100 | #160 | Good 97.4% |
Demographics Similar to Czechoslovakians by 5th Grade
In terms of 5th grade, the demographic groups most similar to Czechoslovakians are Arapaho (98.0%, a difference of 0.0%), Aleut (98.0%, a difference of 0.010%), Native Hawaiian (98.0%, a difference of 0.010%), Ottawa (98.0%, a difference of 0.020%), and Bulgarian (98.0%, a difference of 0.020%).
| Demographics | Rating | Rank | 5th Grade |
| Belgians | 99.9 /100 | #38 | Exceptional 98.1% |
| Luxembourgers | 99.9 /100 | #39 | Exceptional 98.1% |
| Eastern Europeans | 99.9 /100 | #40 | Exceptional 98.1% |
| Hungarians | 99.9 /100 | #41 | Exceptional 98.0% |
| Northern Europeans | 99.9 /100 | #42 | Exceptional 98.0% |
| Ottawa | 99.9 /100 | #43 | Exceptional 98.0% |
| Aleuts | 99.9 /100 | #44 | Exceptional 98.0% |
| Czechoslovakians | 99.9 /100 | #45 | Exceptional 98.0% |
| Arapaho | 99.9 /100 | #46 | Exceptional 98.0% |
| Native Hawaiians | 99.9 /100 | #47 | Exceptional 98.0% |
| Bulgarians | 99.8 /100 | #48 | Exceptional 98.0% |
| Estonians | 99.8 /100 | #49 | Exceptional 98.0% |
| Immigrants | Scotland | 99.8 /100 | #50 | Exceptional 98.0% |
| Celtics | 99.8 /100 | #51 | Exceptional 98.0% |
| Maltese | 99.8 /100 | #52 | Exceptional 98.0% |